Jet and Track Energy Loss Ratios for Decreased Efficiency
Introducing an efficiency reduction to a sample has predictable consequences for both reconstructed jets and tracks in jets, as shown here. However, these consequences may vary with the nature of the data set. Here we show how pT changed in the study shown on this page by computing the ratio of jet and track-in-jet pT between 100% and 90% and between 100% and 40% for each sample.
For sample 1:

Figure 1: Ratio of jet pT at 100% and 90% efficiencies (100%/90%) for sample 1
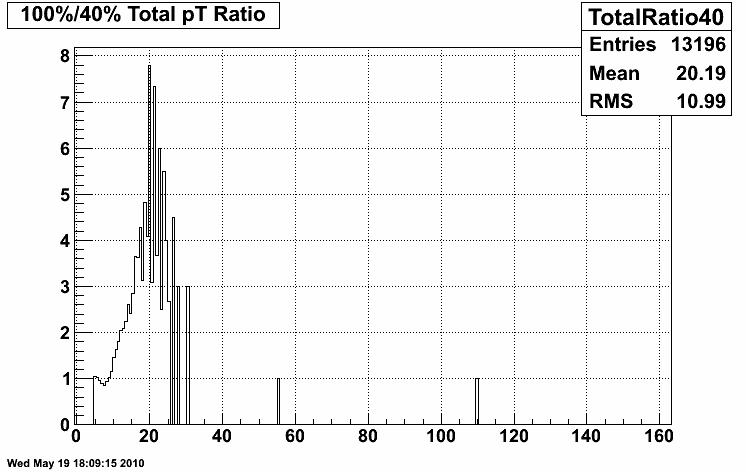
Figure 2: Ratio of jet pT at 100% and 40% efficiencies (100%/40%) for sample 1

Figure 3: Ratio of track-in-jet pT at 100% and 90% efficiencies (100%/90%) for sample 1
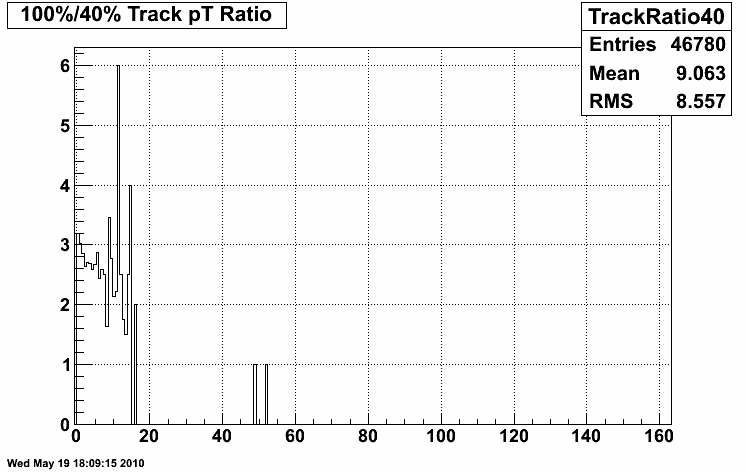
Figure 4: Ratio of track-in-jet pT at 100% and 40% efficiencies (100%/40%) for sample 1
For sample 2:
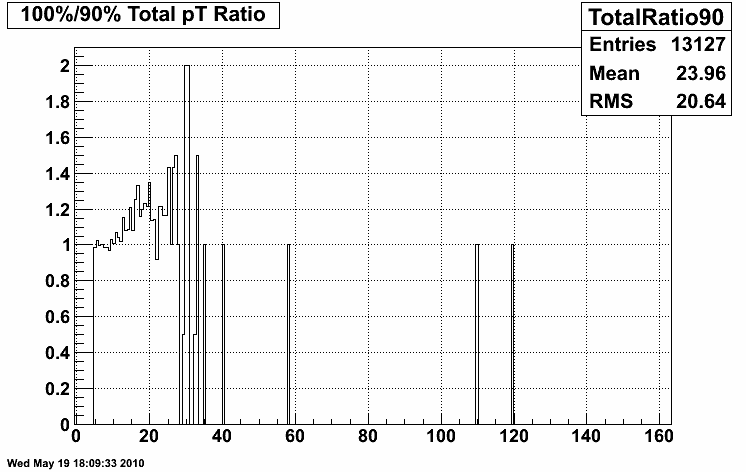
Figure 5: Ratio of jet pT at 100% and 90% efficiencies (100%/90%) for sample 2
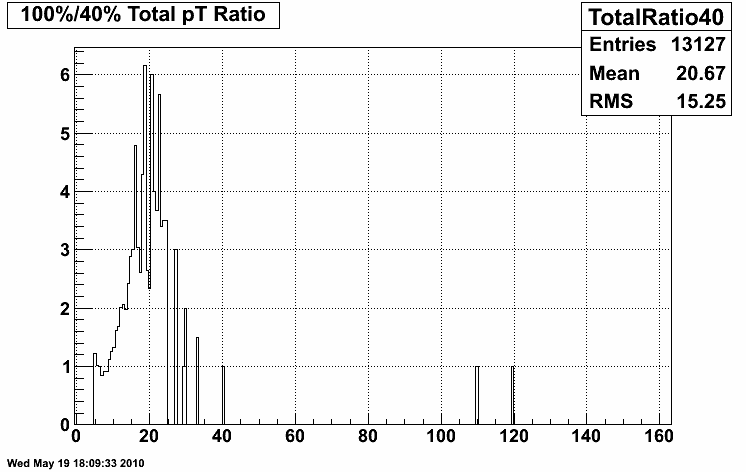
Figure 6: Ratio of jet pT at 100% and 40% efficiencies (100%/40%) for sample 2
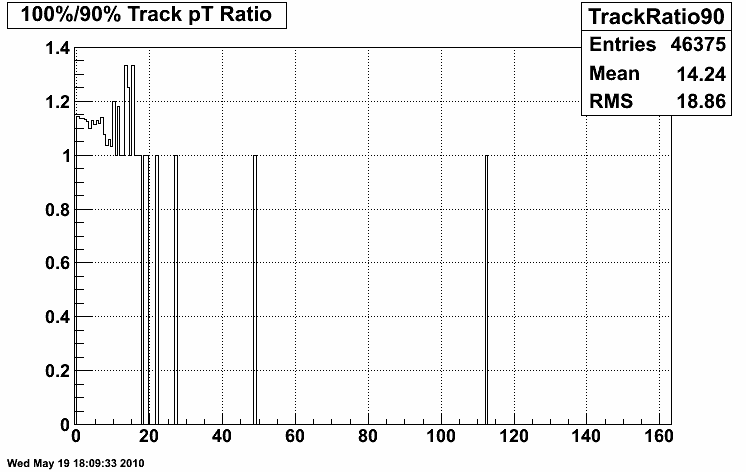
Figure 7: Ratio of track-in-jet pT at 100% and 90% efficiencies (100%/90%) for sample 2
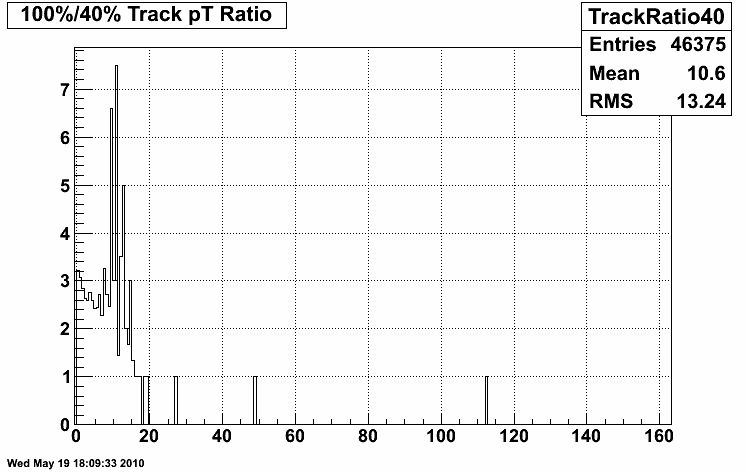
Figure 8: Ratio of track-in-jet pT at 100% and 40% efficiencies (100%/40%) for sample 2
For sample 3:
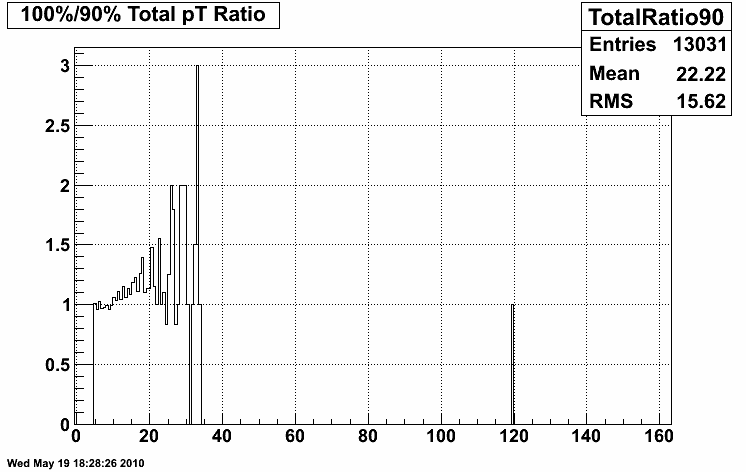
Figure 9: Ratio of jet pT at 100% and 90% efficiencies (100%/90%) for sample 3
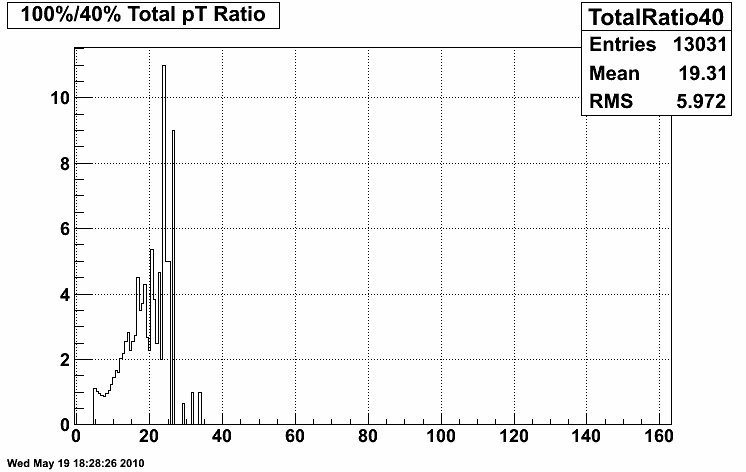
Figure 10: Ratio of jet pT at 100% and 40% efficiencies (100%/40%) for sample 3
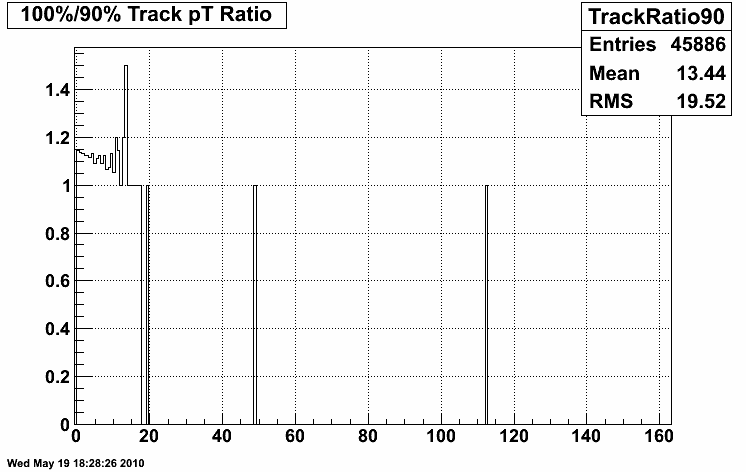
Figure 11: Ratio of track-in-jet pT at 100% and 90% efficiencies (100%/90%) for sample 3
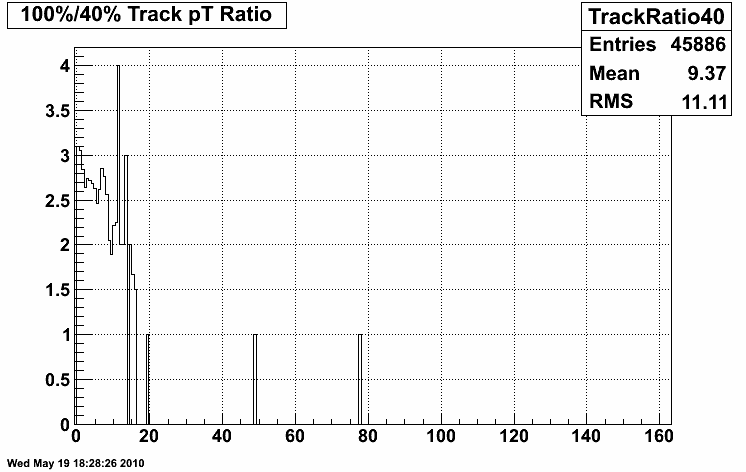
Figure 12: Ratio of track-in-jet pT at 100% and 40% efficiencies (100%/40%) for sample 3
For sample 4:
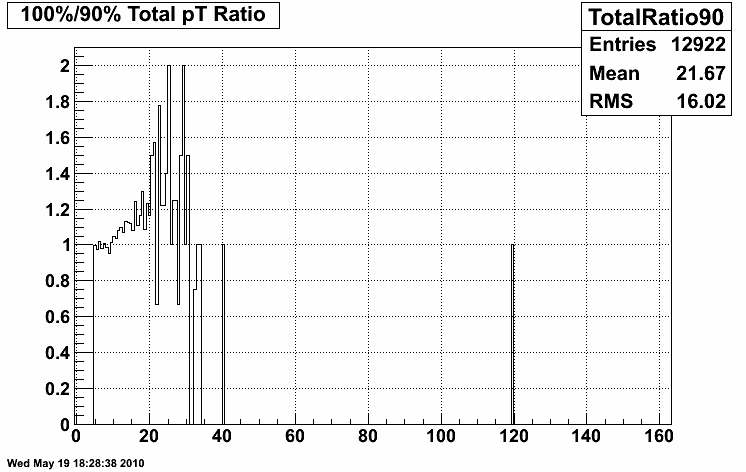
Figure 13: Ratio of jet pT at 100% and 90% efficiencies (100%/90%) for sample 4
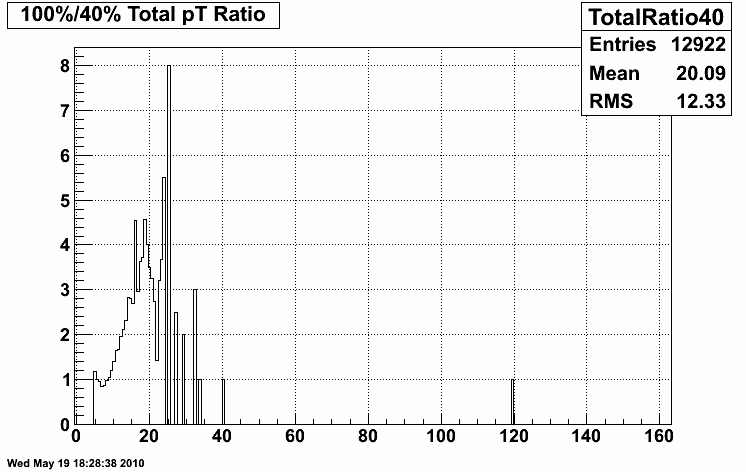
Figure 14: Ratio of jet pT at 100% and 40% efficiencies (100%/40%) for sample 4
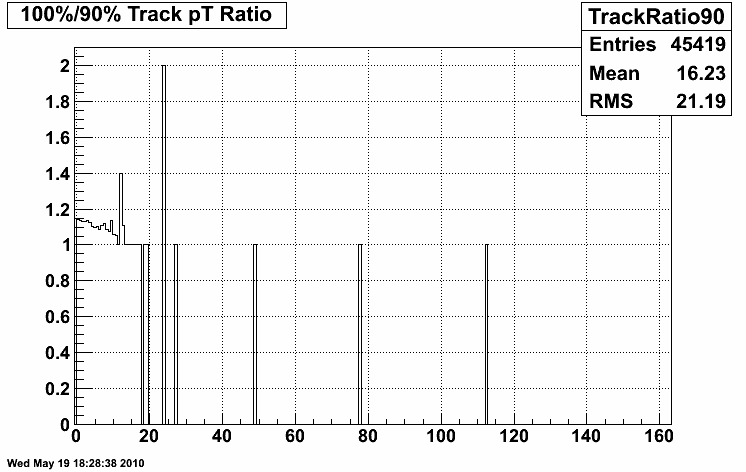
Figure 15: Ratio of track-in-jet pT at 100% and 90% efficiencies (100%/90%) for sample 4
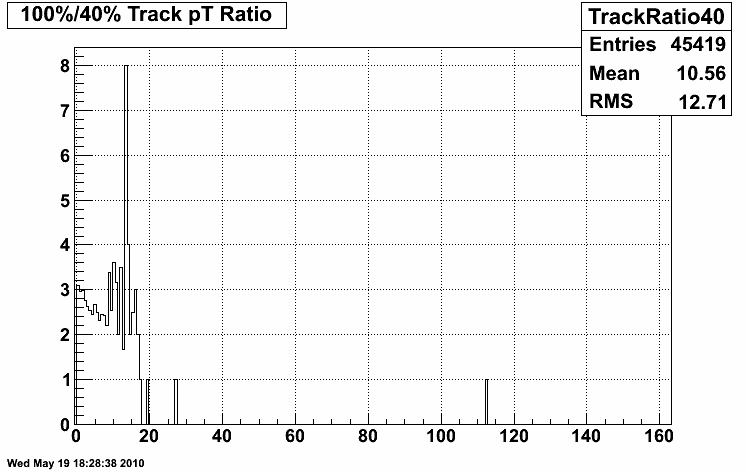
Figure 16: Ratio of track-in-jet pT at 100% and 40% efficiencies (100%/40%) for sample 4
- wwitzke's blog
- Login or register to post comments