Time Dependency in BEMC Gains, Refit with Gain Corrections
To address some concerns and improve the quality of our analysis, we have converted ADC tower response to energy using 2006 gains. We then repeated our analysis in the new scale. This resulted in what appears to be a significant improvement in the individual eta bin histogram fits over time, but without altering the final result of the analysis (that is, there is still an apparently significant change in the energy levels over time).
For comparison, representative original and new histograms with Landau fits are shown below.
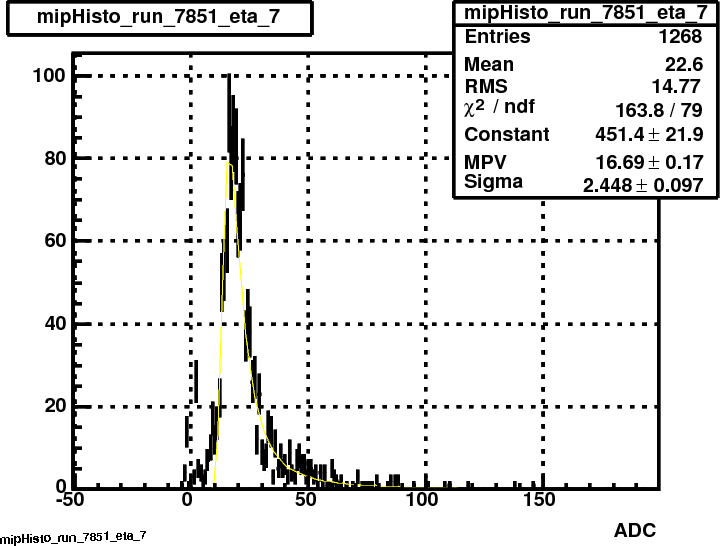
Figure 1: 2006 Eta Bin 7 Fill 7851 ADC Tower Response Histogram, With Landau Fit
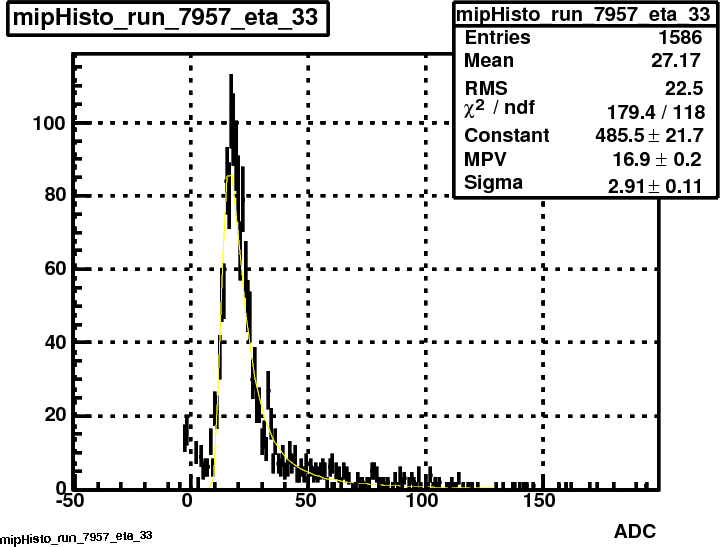
Figure 2: 2006 Eta Bin 33 Fill 7957 ADC Tower Response Histogram, With Landau Fit
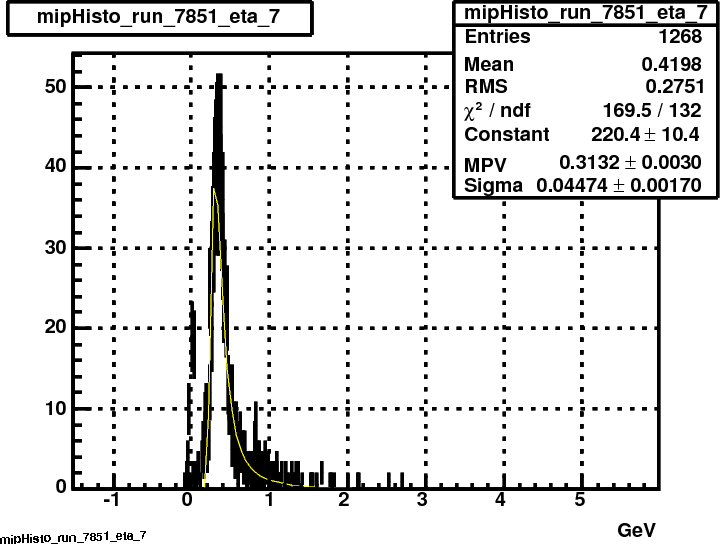
Figure 3: 2006 Eta Bin 7 Fill 7851 Energy Histogram, With Landau Fit
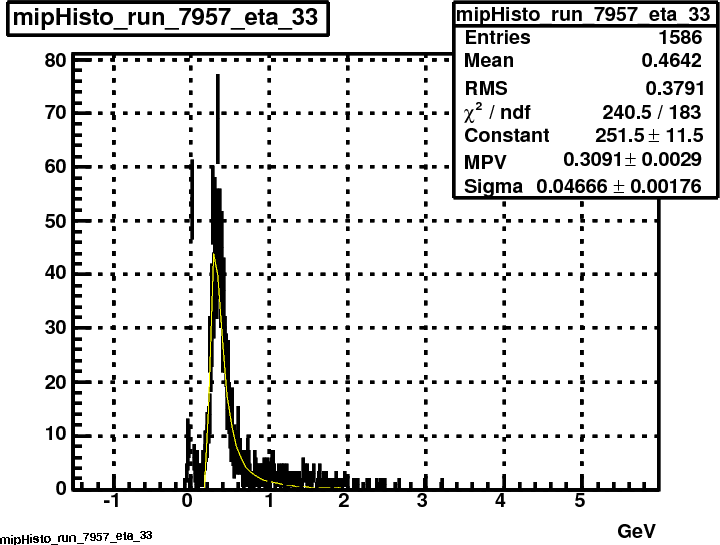
Figure 4: 2006 Eta Bin 33 Fill 7957 Energy Histogram, With Landau Fit
A complete set of histograms and fits for ADC tower responses can be found here. The complete set of energy histograms with Landau fits can be found here.
As can be seen from the following representative plot energy versus time plot, slope plots, and Chi^2 plots from the latter part of our analysis, the overall result of this change in methodology did not have a significant impact on the final outcome of our analysis. The original analysis by day can be found here. The complete set of energy versus time graphs for individual eta bins, along with slopes and Chi^2 graphs, can be found here.
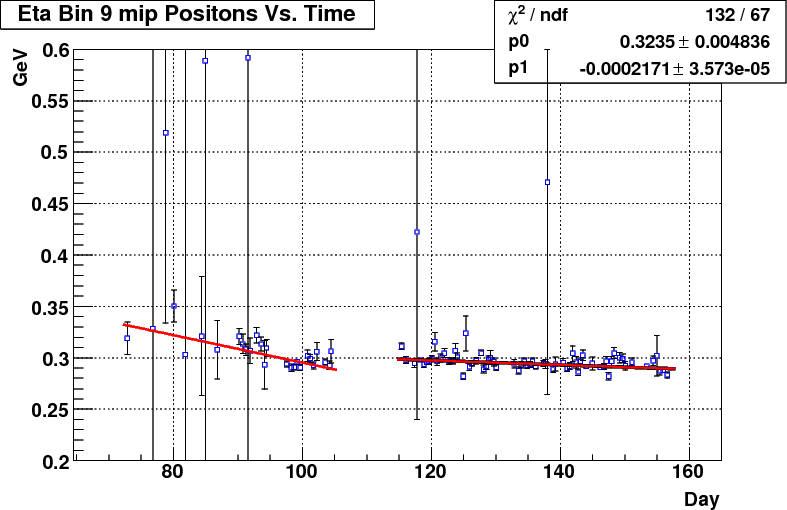
Figure 5: 2006 Eta Bin 9 mip Peak Positions Over Time, Piecewise P1 Fit
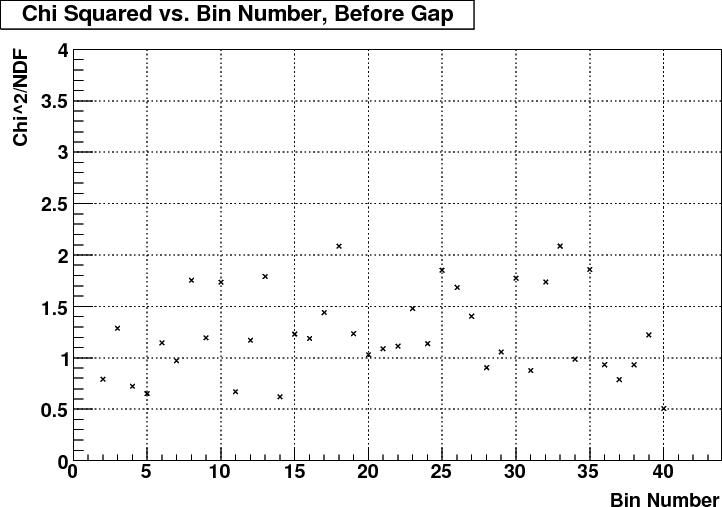
Figure 6: 2006 P1 Fit Chi^2 versus Eta Bin, Before Gap
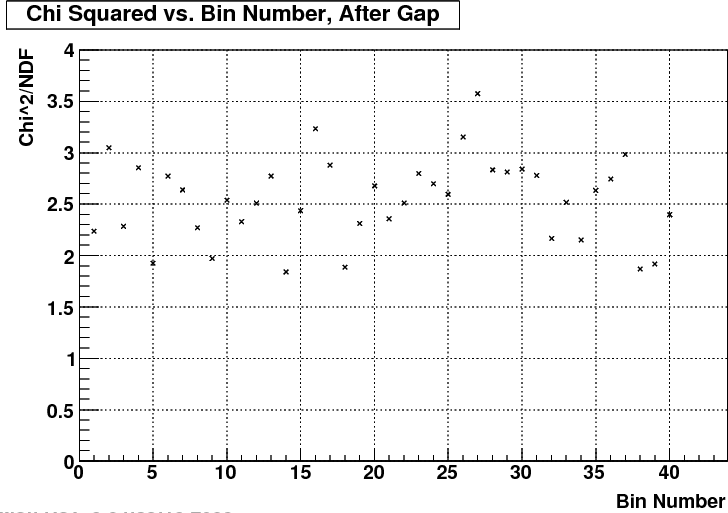
Figure 7: 2006 P1 Fit Chi^2 versus Eta Bin, After Gap
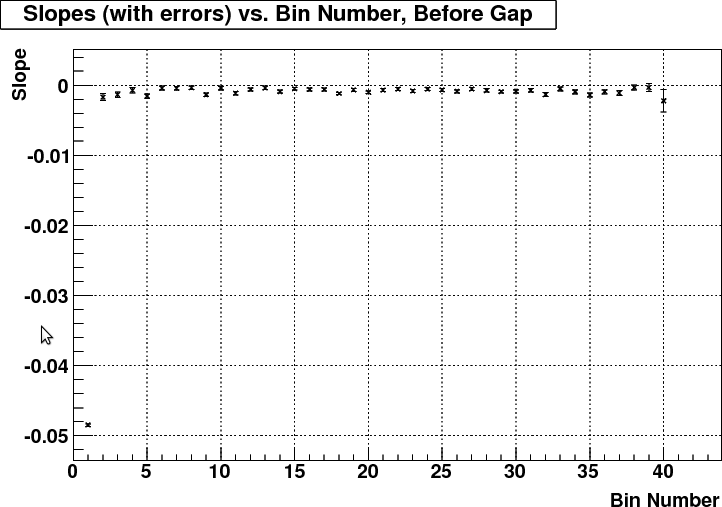
Figure 8: 2006 P1 Slopes versus Eta Bin, Before Gap
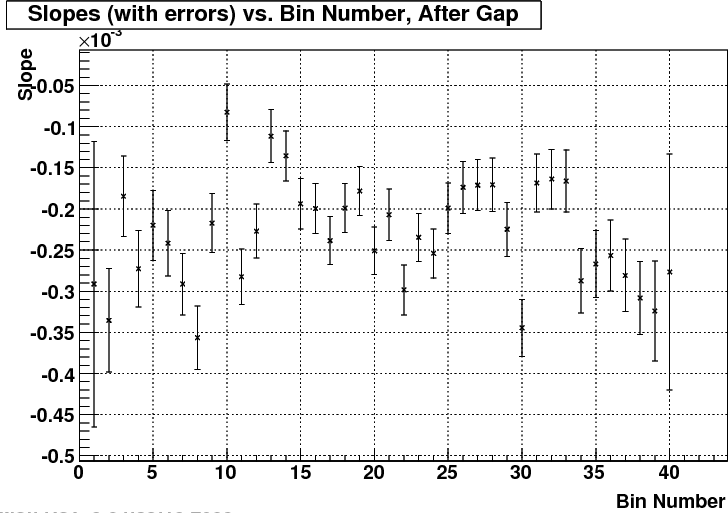
Figure 9: 2006 P1 Slopes versus Eta Bin, Before Gap
For each of these plots, eta bin 1 corresponds to eta = -1, eta = 0 occurs between eta bins 20 and 21, and eta bin 40 corresponds to eta = 1.
- wwitzke's blog
- Login or register to post comments