Time Dependency in BEMC Gains, Piecewise Linear Fit by Day
We are continuing to refine our characterizations of the time-dependence for BEMC gains. We have now done re-scaled the individual gains versus time data sets so that the times used for plotting correspond to floating point day numbers. Specifically, the beginning and ending times for each fill were determined, and the midpoint time for the fill, in days, was used to plot each ADC peak response.
This led to plots that had gaps between days 106 and 115. To eliminate any influence that this large gap might have on slope determination, we fit day ranges 72 through 106 and 115 through 158 separately, and plotted the slopes and Chi^2 values separately as well (the "Before Gap" plots are for the range 72 through 106, and the "After Gap" plots are for the range 106 through 115).
The original analysis can be found here. The linear fit analysis can be found here. The complete set of piecewise, real-time P1 fits, along with Chi^2 and slopes, can be found here.
Here are some samples from the raw P1 fits, along with the Chi^2 and slope graphs:
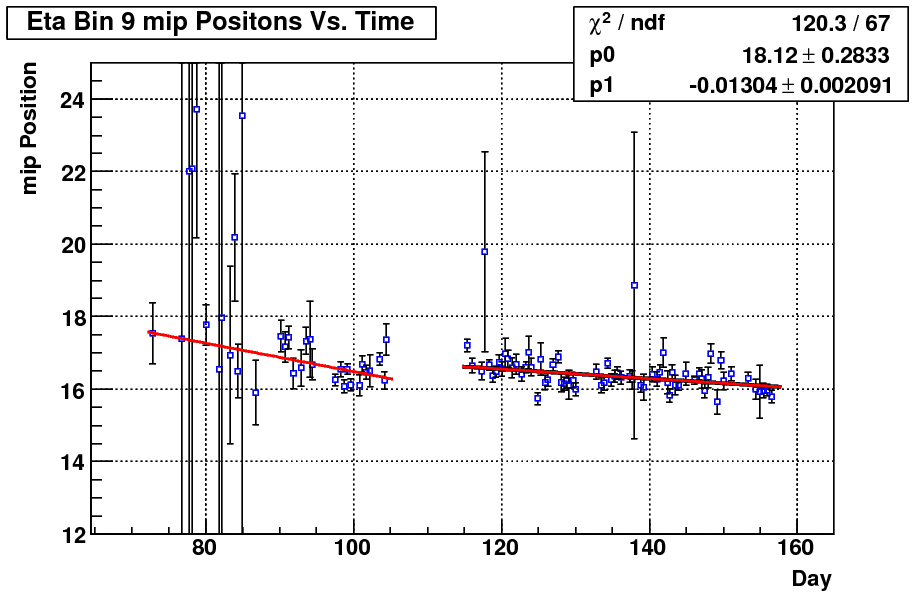
Figure 1: 2006 Eta Bin 9 mip Peak Positions Over Time, Piecewise P1 Fit
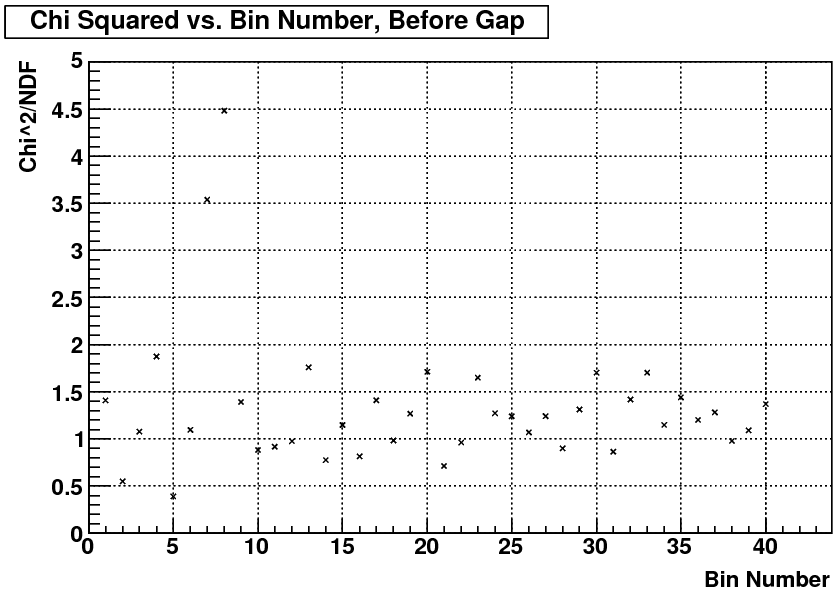
Figure 2: 2006 P1 Fit Chi^2 versus Eta Bin, Before Gap
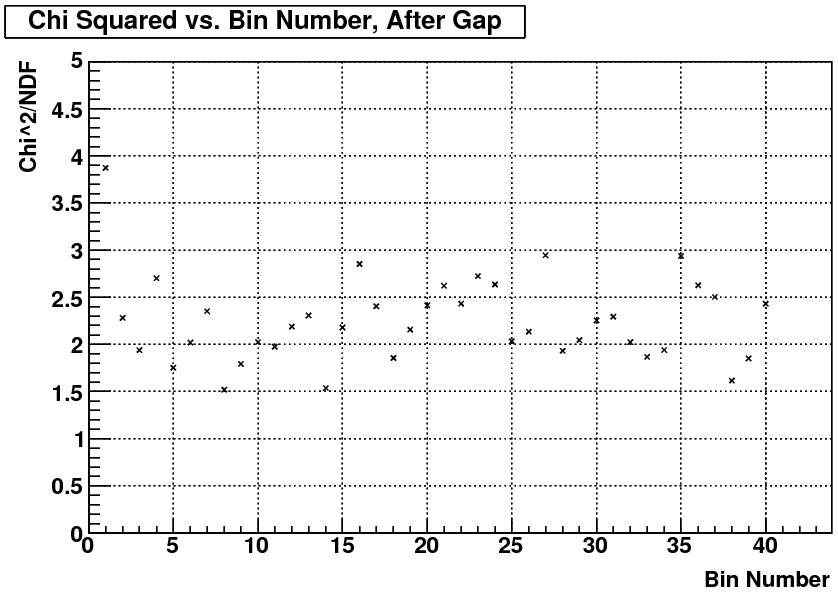
Figure 3: 2006 P1 Fit Chi^2 versus Eta Bin, After Gap
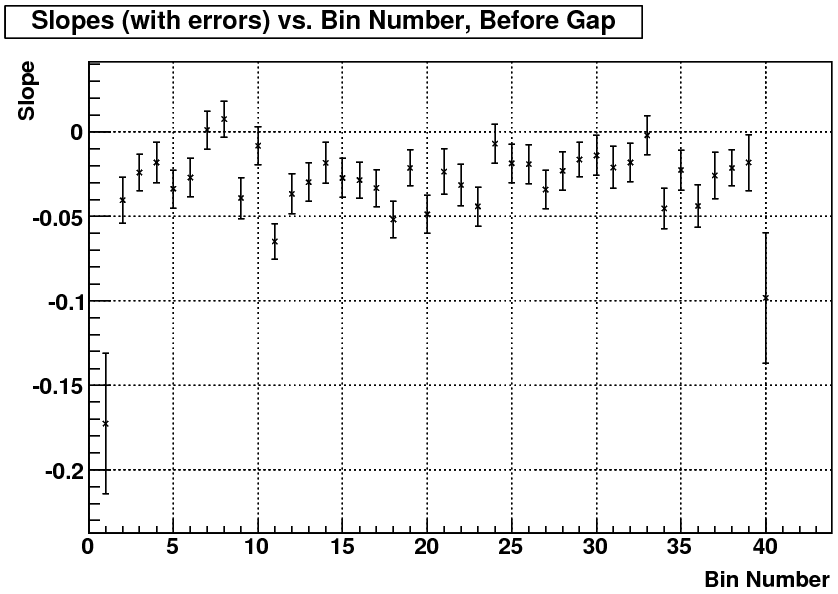
Figure 4: 2006 P1 Slopes versus Eta Bin, Before Gap
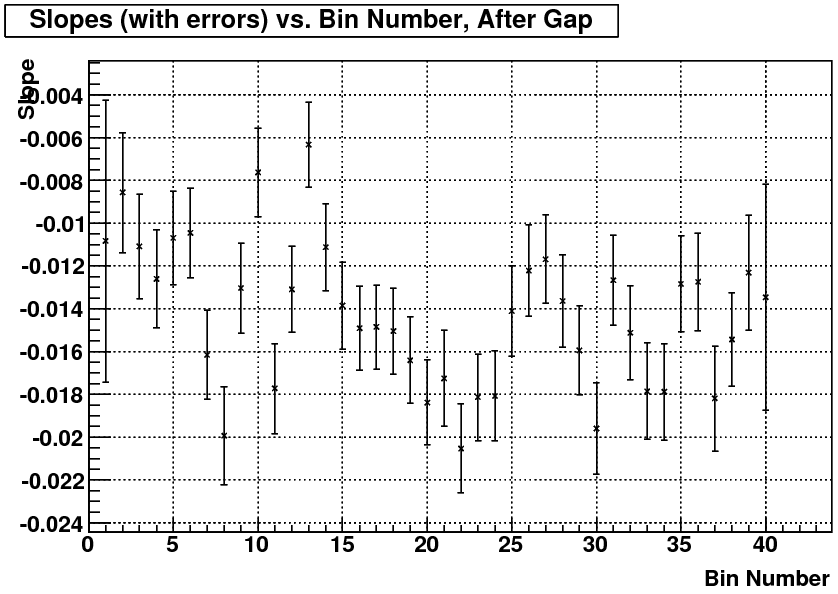
Figure 5: 2006 P1 Slopes versus Eta Bin, Before Gap
For each of these plots, eta bin 1 corresponds to eta = -1, eta = 0 occurs between eta bins 20 and 21, and eta bin 40 corresponds to eta = 1.
- wwitzke's blog
- Login or register to post comments