Paper page: Inclusive jet cross-section in pp collisions at \sqrt{s} = 200 and 510 GeV
Title
Inclusive jet cross-section in pp collisions at $\sqrt{s} = 200$ and 510 GeV
PAs
Elke Aschenauer, Zilong Chang, Renee Fatemi, Dmitry Kalinkin, Scott Wissink
Target Journal
Physical Review D
Abstract
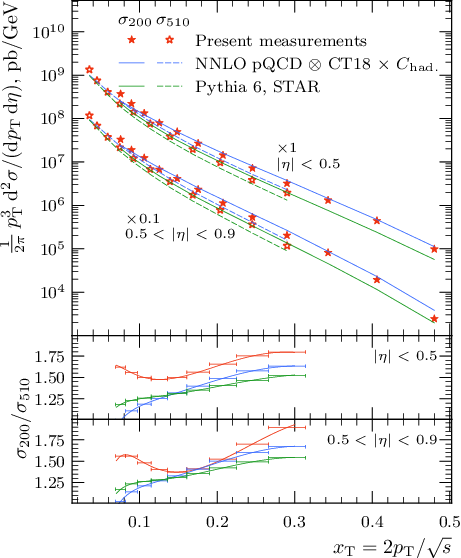
Jets, collimated clusters of particles, produced in pp collisions at the Relativistic Heavy Ion Collider (RHIC) are dominated by gg and qg partonic processes. Therefore jet production in pp collisions allows us to directly probe the gluon parton distribution function (PDF) in the proton in a way complementary to deep inelastic scatterings. In this paper, we report the differential inclusive jet cross-sections as a function of jet transverse momentum, pT, and pseudo-rapidity, η, at center-of-mass energy $\sqrt{s} = 200$ and 510 GeV from pp collisions studied with the STAR detector. At mid-pseudorapidity, |η| < 0.9, the kinematic coverages of our data reach $0.07 < x_{\text{T}}{} = 2p_{\text{T}}{} / \sqrt{s} < 0.5$ and 0.03 < xT < 0.31 at $\sqrt{s} = 200$ and 510 GeV, respectively, where the explored gluon PDF is loosely constrained by the TeV-scale pp(p̄) colliders. The jet pT is corrected for underlying event contributions by applying an off-axis cone method. The inclusive jet cross sections are compared to the perturbative quantum chromodynamics calculations at the next-to-next-to-leading order with inputs from several recent PDF sets. These results will further constrain the gluon PDF, tune Monte Carlo generators, and provide critical reference data needed to study the quark-gluon plasma at STAR.
References
-
CVS: offline/paper/psn0858, (upstream git repo for pp200)
Past presentations
pp200:
-
Spin PWG Meeting - Presentation on unfolding and a follow-up
-
Tracking efficiency uncertainty arc:
-
Preliminary result, Conference talks: DNP2020, DIS2021 and APS April Meeting 2021
-
Collaboration Meeting 2022 - combining triggers, switch R to 0.5 and eta binning to [0, 0.5, 0.9]
-
Spin/Cold QCD Meeting - Trigger promotion data/simulation ratio puzzle
pp510:
-
Collaboration Meeting 2018 - unfolding, uncertainties, comparisons to NLO
-
Collaboration Meeting 2019 Spring - hadronic correction, luminosity
-
Collaboration Meeting 2019 - hadronic correction, luminosity, systematic uncertainties
-
Collaboration Meeting 2020 - new embedding QA, combining triggers, unfolding
-
Analysis note (Including details of the collider luminosity calculation)
-
Collaboration Meeting 2021 Spring - vertex cut and vertex distributions, hadronization correction
-
Collaboration Meeting 2021 Fall - JES uncertainty, hadronization correction
Figures

Tables
Systematics: pp200
| |η| < 0.5 | ||||
|---|---|---|---|---|
| Bin (GeV/c) | Total(%) | Energy scale(%) | Track eff(%) | Unfold(%) |
| 6.9 – 8.2 | 17.2 | 16.0 | 2.1 | 3.3 |
| 8.2 – 9.7 | 25.3 | 24.5 | 1.3 | 5.6 |
| 9.7 – 11.5 | 12.3 | 9.5 | 2.4 | 5.2 |
| 11.5 – 13.6 | 17.0 | 15.7 | 1.5 | 5.7 |
| 13.6 – 16.1 | 10.1 | 8.7 | 2.2 | 3.9 |
| 16.1 – 19.0 | 11.0 | 8.8 | 2.4 | 4.4 |
| 19.0 – 22.5 | 12.9 | 12.0 | 2.5 | 3.5 |
| 22.5 – 26.6 | 8.6 | 7.4 | 2.3 | 3.9 |
| 26.6 – 31.4 | 21.3 | 20.6 | 3.4 | 2.7 |
| 31.4 – 37.2 | 9.6 | 8.8 | 0.8 | 3.4 |
| 37.2 – 44.0 | 25.5 | 23.0 | 5.4 | 7.6 |
| 44.0 – 52.0 | 20.3 | 18.8 | 3.7 | 6.5 |
| 0.5 < |η| < 0.9 | ||||
| Bin (GeV/c) | Total(%) | Energy scale(%) | Track eff(%) | Unfold(%) |
| 6.9 – 8.2 | 18.9 | 17.0 | 1.7 | 4.2 |
| 8.2 – 9.7 | 22.3 | 21.0 | 1.8 | 7.3 |
| 9.7 – 11.5 | 16.2 | 12.8 | 2.0 | 8.1 |
| 11.5 – 13.6 | 14.4 | 12.7 | 1.7 | 6.1 |
| 13.6 – 16.1 | 9.2 | 7.2 | 2.4 | 4.0 |
| 16.1 – 19.0 | 9.7 | 8.9 | 2.5 | 3.0 |
| 19.0 – 22.5 | 11.3 | 10.5 | 1.9 | 2.8 |
| 22.5 – 26.6 | 11.7 | 11.3 | 2.9 | 2.5 |
| 26.6 – 31.4 | 11.5 | 10.9 | 2.7 | 3.2 |
| 31.4 – 37.2 | 15.0 | 14.1 | 3.9 | 4.4 |
| 37.2 – 44.0 | 23.1 | 21.7 | 1.0 | 7.6 |
| 44.0 – 52.0 | 55.7 | 51.8 | 4.6 | 13.5 |
Systematics: pp510
| |η|< 0.5 | ||||
|---|---|---|---|---|
| Bin(GeV/c) | Total(%) | Energy scale(%) | Track eff(%) | Unfold(%) |
| 8 – 10 | 9.8 | 7.3 | 1.4 | 6.3 |
| 10 – 13 | 6.9 | 4.5 | 1.1 | 5.1 |
| 13 – 17 | 7.4 | 4.8 | 3.0 | 4.7 |
| 17 – 21 | 9.5 | 7.0 | 4.1 | 4.9 |
| 21 – 26 | 5.8 | 3.3 | 1.7 | 4.4 |
| 26 – 32 | 8.4 | 5.9 | 3.1 | 5.1 |
| 32 – 39 | 10.8 | 8.5 | 4.4 | 5.0 |
| 39 – 47 | 12.1 | 9.8 | 5.1 | 4.9 |
| 47 – 57 | 15.6 | 12.7 | 6.6 | 6.3 |
| 57 – 68 | 23.9 | 19.7 | 9.7 | 9.5 |
| 68 – 80 | 28.4 | 22.7 | 11.0 | 13.0 |
| 0.5 < |η|< 0.9 | ||||
| Bin(GeV/c) | Total(%) | Energy scale(%) | Track eff(%) | Unfold(%) |
| 8 – 10 | 10.5 | 8.5 | 0.6 | 6.2 |
| 10 – 13 | 7.0 | 4.9 | 0.8 | 5.0 |
| 13 – 17 | 7.5 | 4.9 | 3.3 | 4.5 |
| 17 – 21 | 9.9 | 7.3 | 4.4 | 5.0 |
| 21 – 26 | 5.4 | 2.7 | 1.5 | 4.5 |
| 26 – 32 | 9.1 | 6.7 | 3.6 | 5.1 |
| 32 – 39 | 12.0 | 9.5 | 4.8 | 5.6 |
| 39 – 47 | 13.5 | 11.2 | 5.5 | 5.3 |
| 47 – 57 | 16.4 | 13.7 | 6.6 | 6.2 |
| 57 – 68 | 27.1 | 21.6 | 9.9 | 13.0 |
| 68 – 80 | 28.4 | 24.2 | 10.9 | 10.3 |
Results: pp200
| |η| < 0.5 | |
|---|---|
| (pT − ΔpTUE) (GeV/c) | $\frac{\mathrm{d}\sigma^2}{\mathrm{d}p_{\text{T}}\mathrm{d}\eta} (\text{pb}/\text{GeV})$ ± stat.(%) ± syst. (%) |
| 6.9 – 8.2 | 5.42 × 10⁶ ± 0.4% ± 17.1% |
| 8.2 – 9.7 | 1.95 × 10⁶ ± 0.5% ± 25.4% |
| 9.7 – 11.5 | 7.03 × 10⁵ ± 0.5% ± 12.5% |
| 11.5 – 13.6 | 2.53 × 10⁵ ± 0.5% ± 17.3% |
| 13.6 – 16.1 | 9.51 × 10⁴ ± 0.6% ± 10.7% |
| 16.1 – 19.0 | 3.14 × 10⁴ ± 0.7% ± 8.8% |
| 19.0 – 22.5 | 1.01 × 10⁴ ± 1.0% ± 13.0% |
| 22.5 – 26.6 | 3.06 × 10³ ± 1.4% ± 9.9% |
| 26.6 – 31.4 | 8.31 × 10² ± 2.3% ± 12.3% |
| 31.4 – 37.2 | 2.05 × 10² ± 3.8% ± 12.9% |
| 37.2 – 44.0 | 4.15 × 101 ± 7.3% ± 16.2% |
| 44.0 – 52.0 | 5.59 × 100 ± 15.4% ± 26.4% |
| 0.5 < |η| < 0.9 | |
| (pT − ΔpTUE) (GeV/c) | $\frac{\mathrm{d}\sigma^2}{\mathrm{d}p_{\text{T}}\mathrm{d}\eta} (\text{pb}/\text{GeV})$ ± stat.(%) ± syst. (%) |
| 6.9 – 8.2 | 4.84 × 10⁶ ± 0.4% ± 19.1% |
| 8.2 – 9.7 | 1.67 × 10⁶ ± 0.6% ± 20.3% |
| 9.7 – 11.5 | 6.54 × 10⁵ ± 0.6% ± 19.4% |
| 11.5 – 13.6 | 2.14 × 10⁵ ± 0.7% ± 16.6% |
| 13.6 – 16.1 | 7.99 × 10⁴ ± 0.7% ± 9.9% |
| 16.1 – 19.0 | 2.71 × 10⁴ ± 1.0% ± 12.0% |
| 19.0 – 22.5 | 7.96 × 10³ ± 1.3% ± 9.8% |
| 22.5 – 26.6 | 2.26 × 10³ ± 2.0% ± 12.8% |
| 26.6 – 31.4 | 5.25 × 10² ± 3.5% ± 10.5% |
| 31.4 – 37.2 | 1.27 × 10² ± 5.7% ± 15.2% |
| 37.2 – 44.0 | 1.82 × 101 ± 13.8% ± 17.9% |
| 44.0 – 52.0 | 1.39 × 100 ± 43.5% ± 35.1% |
Results: pp510
| |η|< 0.5 | |
|---|---|
| (pT − ΔpTUE) (GeV/c) | $\frac{\mathrm{d}\sigma^2}{\mathrm{d}p_{\text{T}}\mathrm{d}\eta} (\text{pb}/\text{GeV})$ ± stat.(%) ± syst. (%) |
| 8 – 10 | 1.16×10⁷ ± 0.2% ± 9.8 % |
| 10 – 13 | 3.11×10⁶ ± 0.1% ± 6.9 % |
| 13 – 17 | 7.65×10⁵ ± 0.2% ± 7.4 % |
| 17 – 21 | 2.02×10⁵ ± 0.4% ± 9.5 % |
| 21 – 26 | 6.89×10⁴ ± 0.3% ± 5.8 % |
| 26 – 32 | 1.95×10⁴ ± 0.4% ± 8.4 % |
| 32 – 39 | 5.45×10³ ± 0.7% ± 10.8 % |
| 39 – 47 | 1.55×10³ ± 1.1% ± 12.1 % |
| 47 – 57 | 434 ± 1.5% ± 15.6 % |
| 57 – 68 | 99.2 ± 4.0% ± 23.9 % |
| 68 – 80 | 30.4 ± 4.1% ± 28.4 % |
| 0.5 < |η|< 0.9 | |
| (pT − ΔpTUE) (GeV/c) | $\frac{\mathrm{d}\sigma^2}{\mathrm{d}p_{\text{T}}\mathrm{d}\eta} (\text{pb}/\text{GeV})$ ± stat.(%) ± syst. (%) |
| 8 – 10 | 1.02×10⁷ ± 0.3% ± 10.5 % |
| 10 – 13 | 2.83×10⁶ ± 0.2% ± 7.0 % |
| 13 – 17 | 6.99×10⁵ ± 0.3% ± 7.5 % |
| 17 – 21 | 1.98×10⁵ ± 0.5% ± 9.9 % |
| 21 – 26 | 5.87×10⁴ ± 0.4% ± 5.4 % |
| 26 – 32 | 1.75×10⁴ ± 0.6% ± 9.1 % |
| 32 – 39 | 5.01×10³ ± 0.9% ± 12.0 % |
| 39 – 47 | 1.38×10³ ± 1.4% ± 13.5 % |
| 47 – 57 | 349 ± 2.1% ± 16.4 % |
| 57 – 68 | 93.4 ± 4.5% ± 27.1 % |
| 68 – 80 | 18.1 ± 6.9% ± 28.4 % |
- veprbl's blog
- Login or register to post comments