- stevens4's home page
- Posts
- 2014
- 2013
- 2012
- 2011
- December (1)
- November (2)
- October (1)
- September (1)
- August (2)
- July (3)
- June (7)
- May (2)
- April (2)
- March (5)
- February (2)
- January (2)
- 2010
- November (1)
- October (1)
- September (3)
- August (3)
- July (3)
- June (1)
- May (1)
- April (3)
- March (4)
- February (4)
- January (8)
- 2009
- December (4)
- November (3)
- October (4)
- September (5)
- August (1)
- July (2)
- June (2)
- April (1)
- March (1)
- February (2)
- January (1)
- 2008
- My blog
- Post new blog entry
- All blogs
W Track QA cut efficiency vs Reconstructed Track Pt
W Track QA cut efficiency vs Reconstructed Track Pt
Figure 1: Reconstructed track 1/PT for events satisfying all W cuts with BTOW cluster ET > 25 GeV. Data (left), Embedding (center), and Ratio Data/Embedding (right)
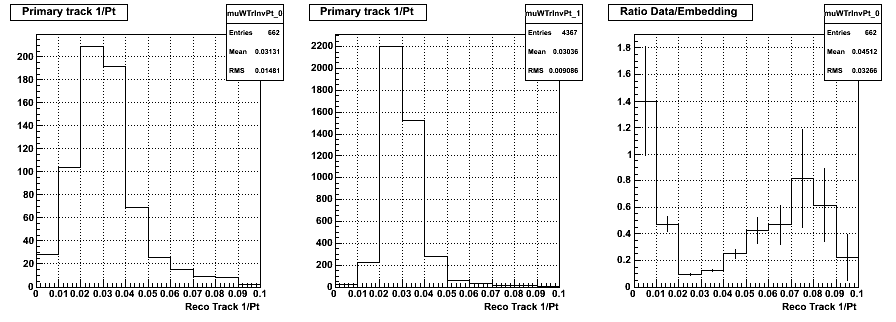
By selecting events that satisfy all the W cuts in the data with ET > 25 GeV, we're looking at a fairly clean W signal in the data to compare with the embedding sample with all the same cuts which should have a fairly narrow range in true electron ET. Clearly the reconstructed track PT distribution is wider in the data than the embedding. Lower quality tracks are more likely to be given an incorrect reconstructed PT so the data appears to have more of these lower quality tracks represented by the larger tails of the 1/PT distribution compared to the embedding. These lower quaility tracks should have a lower efficiency to pass our track QA cuts, thus the embedding should be reweighted to account for this.
To estimate the affect this might have I looked at the efficiency for a reconstructed track to pass our track QA cuts (nHits>15, nHits/nPoss>0.51, RxyIn < 90 and RxyOut > 160) as a function of reconstructed track 1/PT. I used the idTruth variable to be sure I have the correct reconstructed track associated with the electron MC track. Figure 2 below shows this track QA cut efficiency vs 1/recoPT.
Figure 2: Efficiency for a reconstructed track to pass our track QA cuts. Wplus (left) and Wminus (right).
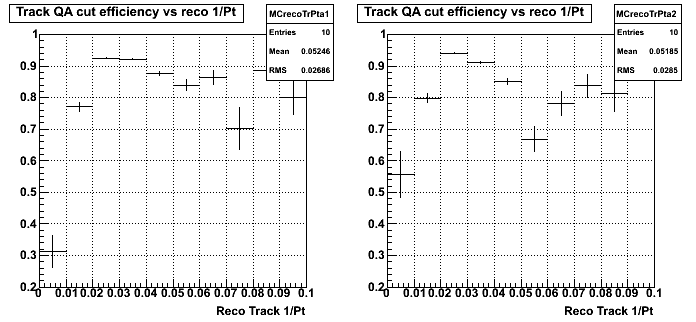
So clearly there is a lower efficiency for tracks to satisfy our track QA cuts if it is in the tails of the reconstructed 1/PT distribution. Since the data PT distribution is wider than the embedding, the average efficiency from the current embedding undersamples these lower efficiency regions. Thus the average efficiency should be smaller if the reconstructed 1/PT distributions matched between data and embedding. To estimate the size of this correction I reweighted the embedding by the Ratio Data/Embedding (Figure 1 right) and the average efficiency goes down by ~4.5% for W+ and ~4.0% for W-. The statistics in the tails of the embedding and data reconstructed 1/PT distribution aren't great so the normalization and efficiency are statistically, which leads to an absolute uncertainty of ~3.4% forthis correction.
Notes: The tracking efficiency is ~constant vs. true electron PT (from the geant record) so this appears to be a reconstruction issue only.
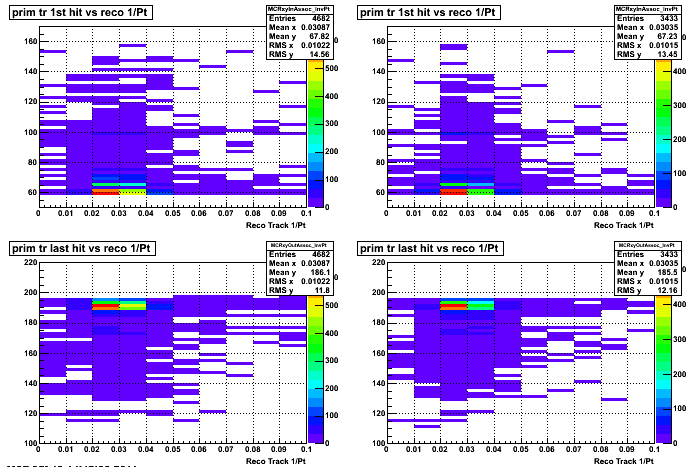
Below are the track QA variables for the embedding vs 1/PT. In both figure 3 and 4 left column is Wplus and the right is Wminus. There isn't much dramatic changing, but the low and high reconstructed track 1/PT distrubutions look a little broader in the track QA variables which results in the lower efficiency.
Figure 3: Top Row: nHit vs reco 1/PT. Bottom Row: nHit/nPoss vs reco 1/PT.
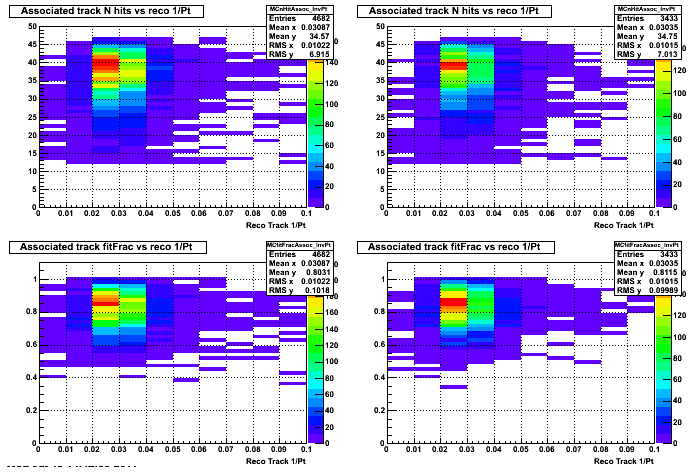
Figure 4: Top Row: First hit R vs reco 1/PT. Bottom Row: Last hit R vs reco 1/PT.
Groups:
- stevens4's blog
- Login or register to post comments