- stevens4's home page
- Posts
- 2014
- 2013
- 2012
- 2011
- December (1)
- November (2)
- October (1)
- September (1)
- August (2)
- July (3)
- June (7)
- May (2)
- April (2)
- March (5)
- February (2)
- January (2)
- 2010
- November (1)
- October (1)
- September (3)
- August (3)
- July (3)
- June (1)
- May (1)
- April (3)
- March (4)
- February (4)
- January (8)
- 2009
- December (4)
- November (3)
- October (4)
- September (5)
- August (1)
- July (2)
- June (2)
- April (1)
- March (1)
- February (2)
- January (1)
- 2008
- My blog
- Post new blog entry
- All blogs
Kinematics of W production
Kinematics of W production
Recently, Scott posted a blog describing some initial state parton kinematics for W production. This page explores some of those ideas in more detail with the W Monte-Carlo simulations, and the data. All the figures below are made after the "standard" W cuts.
Note: A short write-up of the kinematics used to produce the plots shown on this page is attached.
W Monte-Carlo Sample:
Figure 1: Electron Energy vs W pL for 3 ranges of electron eta. (All electron ET)
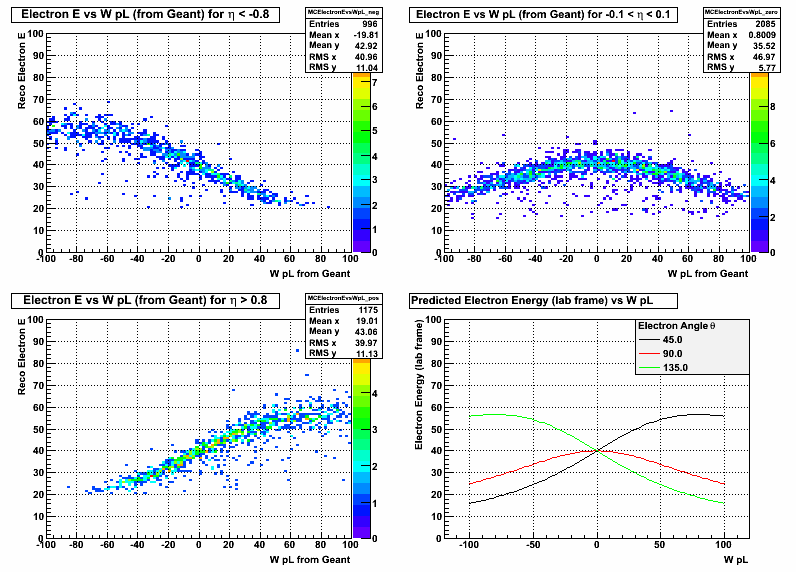
The lower right plot was made using the eqn. (3) in the attached file. It assumes the W pT = 0, and the electron is emitted isotropically in the W rest frame. It is a prediction (based simply on kinematics) of what the distribution should look like in the MC. We see that the reconstructed Electron E vs W pL agree very well with the predicted curves in the lower right. They are smeared out by the W pT distribution in the MC, and the integration over a range of theta.
Figure 2: Reconstructed W pL vs Geant W pL. (All electron ET)
.png)
From eqn. (5) in the attached file, you can see that when reconstructing W pL there are 2 solutions. The upper 2 plots represent those 2 possible solutions for all electron eta, where Reco W pL for the left column is calculated using the + sign in eqn (5), and the right column uses the - sign. The bottom 4 plots show the correlation for different electron eta ranges. As we expect in some eta ranges the function is nearly single valued, and we can get back to the underlying partonic kinematics. Here is the same plot sorted by the charge of the primary track, electrons and positrons.
Comparing W-MC with Data: To compare MC with data we need to select Electron ET > 30, since this is where we think the QCD background is small compared to our W signal.
Figure 3: Electron Energy vs W pL for 3 ranges of electron eta. (Electron ET > 30)
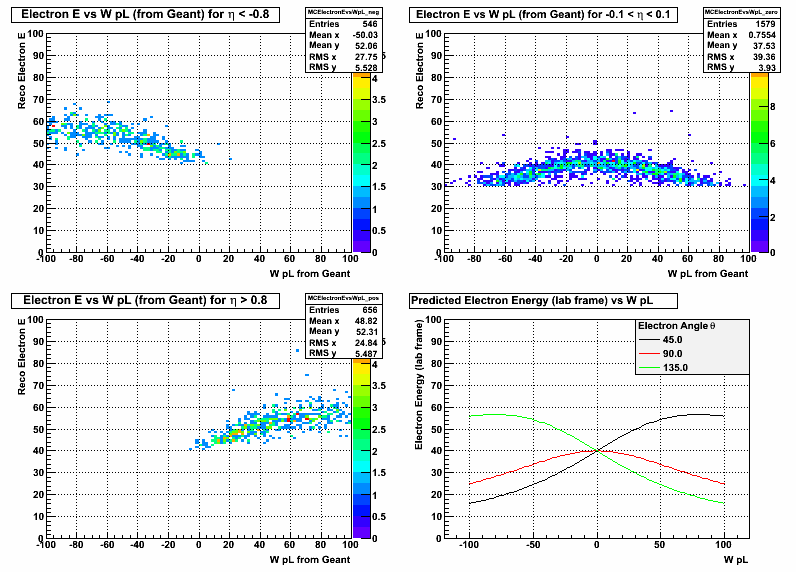
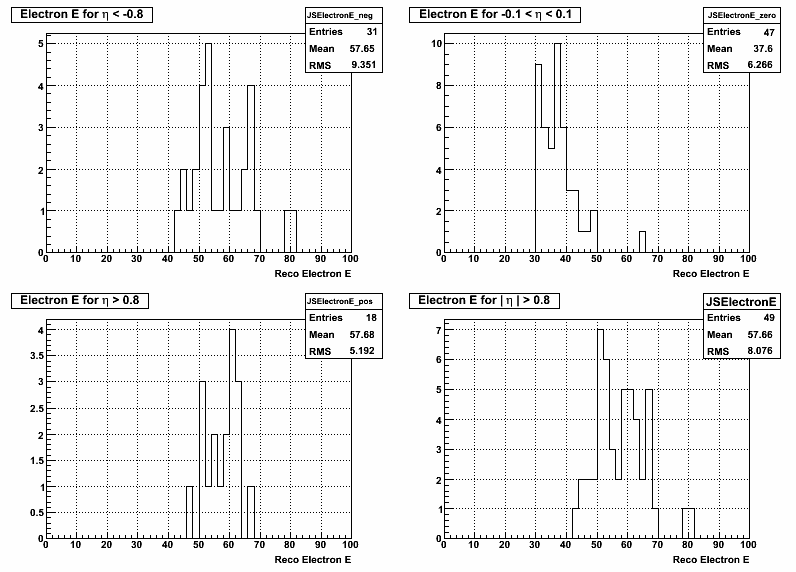
Figure 4: Electron Energy for 3 ranges of electron eta. (Electron ET > 30)

This is just a 1D projection on the y-axis of figure 3, but since it's all we have in the data. So now this can be compared with figure 5 below.
Data:
Figure 5: Electron Energy for 3 ranges of electron eta.
Statistics are pretty small in the data, so not sure what we can see from this. Maybe I should integrate over some larger theta (eta) range for next time.
Groups:
- stevens4's blog
- Login or register to post comments