- rcorliss's home page
- Posts
- 2013
- January (1)
- 2012
- 2011
- 2010
- December (1)
- October (2)
- September (2)
- August (2)
- June (2)
- May (3)
- April (3)
- March (5)
- February (2)
- January (8)
- 2009
- December (5)
- November (1)
- October (7)
- September (10)
- August (4)
- July (3)
- May (1)
- February (1)
- January (1)
- 2008
- 2007
- My blog
- Post new blog entry
- All blogs
Assessing the BHT3 ~coincidence trigger
How it works:
I create a sort of coincidence trigger by requiring a minimum response in the trigger pathes opposite the highest single patch. The plot below (fig 1) shows the vernier scan broken up by the ADC sum of all the patches >10 units in phi (1/3 of the detector) away from the high tower. 90 is the pedestal of all these patches summed together. I require >97 for the BHT3 ~coincidence, corresponding to 7 ADCs above the pedestal value.
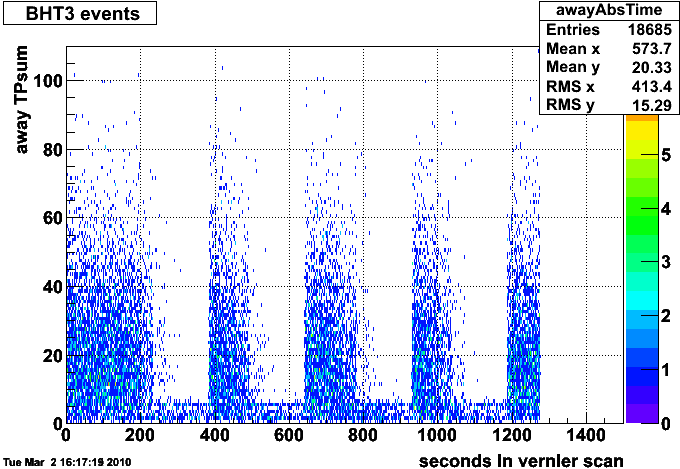
figure 1, pedestal-subtracted sum of trigger patch ADCs for all patches >10 units in phi away from the highest trigger patch found in the event, shown vs time in the vernier scan. The vernier scan structure is clearly visible, as is the fact that the noise that appears when the two beams are far from one another is contained entirely in a band ADC sum < 7. This plot has subtracted off a pedestal of 90, hence the cut I describe here is called 'adc>97' elsewhere.
The vernier scan analysis can be performed on just the subset of events that falls above this line (fig 2), and we see a dramatic improvement - the shape is now gaussian, the background rate has become very small.

figure 2, vernier scan fit applied to events that have an away sum > 97. The reduced chi squared is still not exactly one but is much closer than previous. The absolute cross section can't be directly compared to the previous, because we're only measuring it over a subset of the events previously included.
Uncertainties:
I repeated the analysis that leads to the two largest uncertainties in the cross section reported for APS. First is the nongaussianity, which I characterized by the % shift between the cross section extracted from the fit with all data points included and the fit with only the four points closest to the peaks included (eg fig 3). Previously, this was 12%. In the new table (table 1), the spread is 394-352/394=11% or 398-362/398=9%. For the moment I take the greatest extent, so 11%. Since the chi squared (31/23) is much better than in the APS version (102/26), I'd really like to find a better way to characterize this uncertainty -- it should get smaller.
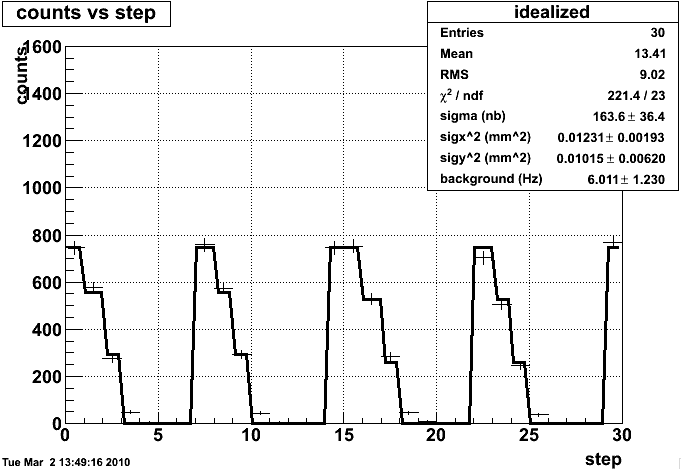
figure 3, the vernier scan analysis applied to only the first three data points in each step. The function has been altered to force it to be zero outside of this range, as can be seen by its failure to fit the next point in the series.
| nfitpoints | 10097097 | 10103044 |
| 1 | 98+/-4* | 66+/-2* |
| 2 | 180+/-22 | 81+/-12 |
| 3 | 160+/-36 | 270+/-49 |
| 4 | 352+/-17 | 362+/-19 |
| 5 | 384+/-9 | 391+/-12 |
| 6 | 391+/-9 | 397+/-11 |
| 7 | 394+/-9 | 398+/-11 |
table 1, the cross sections reported by the partial fits for each of the vernier scan runs. The bolded values are the ones used to compute the uncertainty from the fit function.
The other large contribution to the systematic uncertainty was the background shape uncertainty. This was calculated by taking the background level reported from the full fit, and varying that by +/-25% to cover the fluctuations seen in a more careful analysis. That analysis isn't possible to do with this new set because the background is much sparser, but if we assume 50%*, we can repeat this and find a 1% change in the cross section resulting from it (table 2). Previously this value was 10%. This is the sort of improvement I expected, though a better way to motivate the 50% would be good, since we can't look at the abort gaps very reliably anymore.
| multiplier | 10097097 | 10103044 |
| 1.5* | 391+/-5 | 393+/-10 |
| 1.25 | 392+/-8 | 395+/-10 |
| 1.0 | 394+/-8 | 398+/-10 |
| 0.75 | 395+/-8 | 400+/-6 |
| 0.5 | 397+/-8 | 404+/-10 |
table 2, cross section reported by the fit when the background is not a free parameter, but instead taken to be the nominal value times a multiplier. The bolded entires are the values used to calculate the systematic uncertainty from background shape. (* the fit for 10097097 is for some reason unstable at 1.5, so a multiplier of 1.45 was used instead.)
Assuming the other uncertainties have not changed, the value for this improved analysis is:
sigma_BHT3coin=410nb +/- 10 (stat) +/- 14%
Applying this cross section to the data, we can extract a new luminosity table, and read off the total luminosity... unfortunately, I accidentally clobbered a few dozen lines of code I need. I'm working on this, and will hopefully have the number available for the meeting this evening.
Checking for weird behavior:
Because the W events are no longer strictly a subset of the sort of events that appear in the luminosity monitor (W events peak in the same region I exclude to reduce noise), it becomes important to make sure we're not differently affected by changes in the behavior of the BEMC etc. For now, I checked this by looking at the distribution of events that pass the ~coincidence trigger:
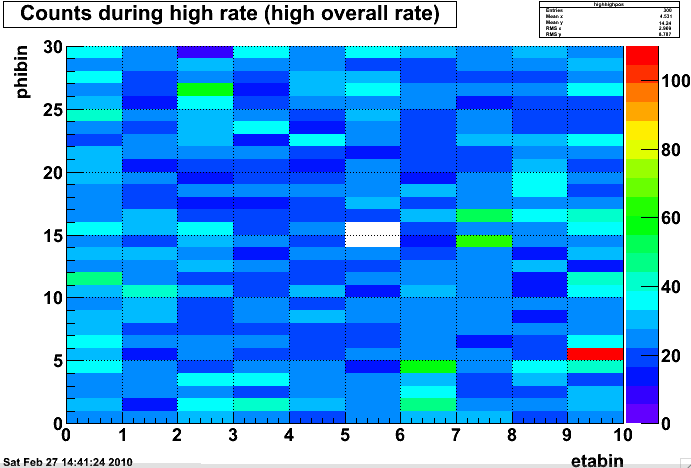
figure ??1, eta-phi position of high tower for events with away sum > 97, summed over regions where the beams are relatively close. With the exception of a hot tower, this seems reasonably flat in phi (though I can codify it better by fitting it to a flat plane). In eta, there seems to be higher count rates at the edges.
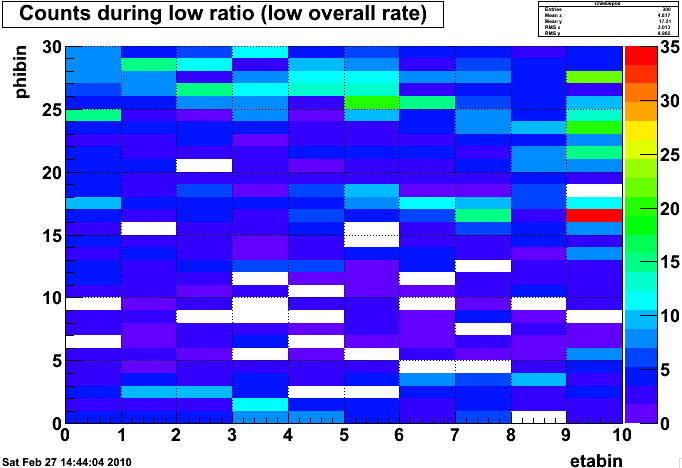
figure ??2, eta-phi position of high tower for events with away sum <= 97, summed over regions where the beams are far apart. There is a clear phi shape, as well as an eta dependence similar to the previous figure.
Task list:
-fix code so I can get the luminosity number out (in progress)...
-find a better way to do the nongaussianity systematic
-find a better way to pick the multiplier for the background systematic, or another way to do it.
-automate checking the flatness of the eta-phi distribution of luminosity monitor events so it can be done across the whole dataset
-investigate whether we still need to include 'single beam background corrections' (I suspect not).
-check stability of this against the ADC value of the cut, as well as the size of the away-side region.
-suggestions?
Groups:
- rcorliss's blog
- Login or register to post comments