Comparison of Jet V2 in Samples used for Ratio
As a reminder, I am dividing my dataset in half and measuring the numerator and denominator for the ratio of different jet resolutions separately. This it to make the statistical uncertainties totally uncorrelated, since otherwise it is not entirely obvious what a comparison means when some but not all populations share parton kinematics. There are likely ways to improve this in the future for the paper and so on.
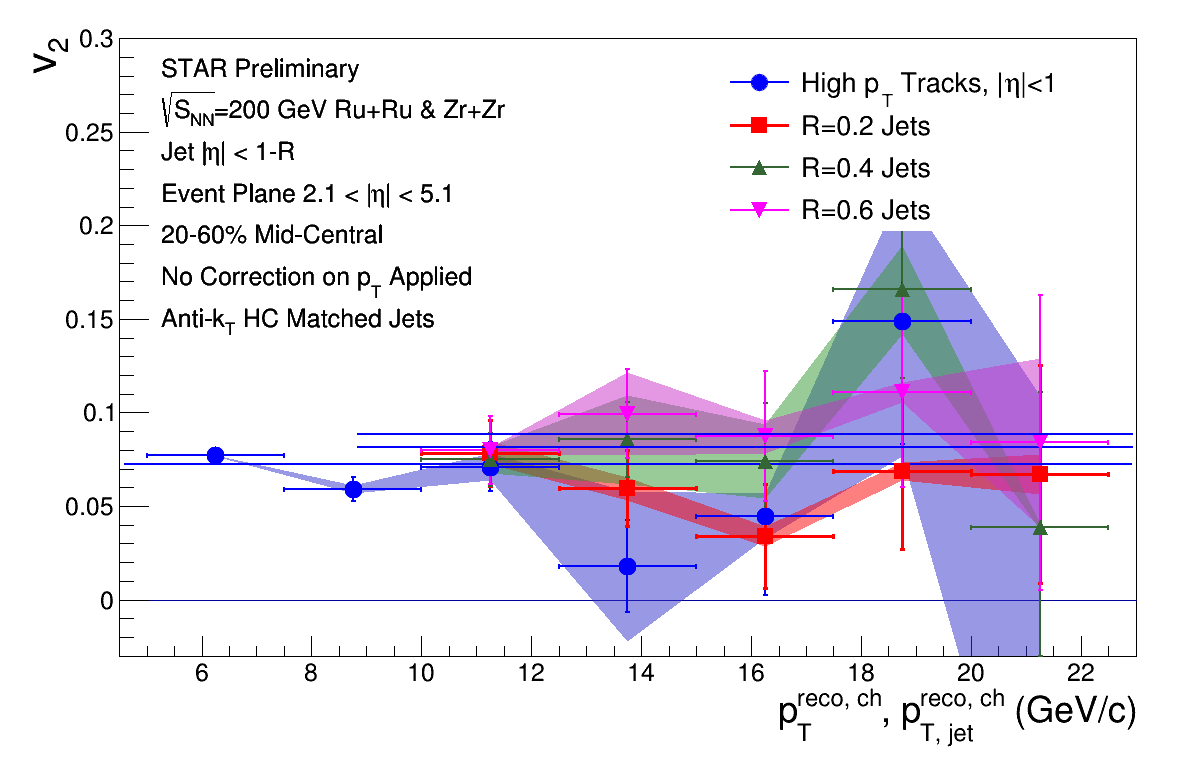
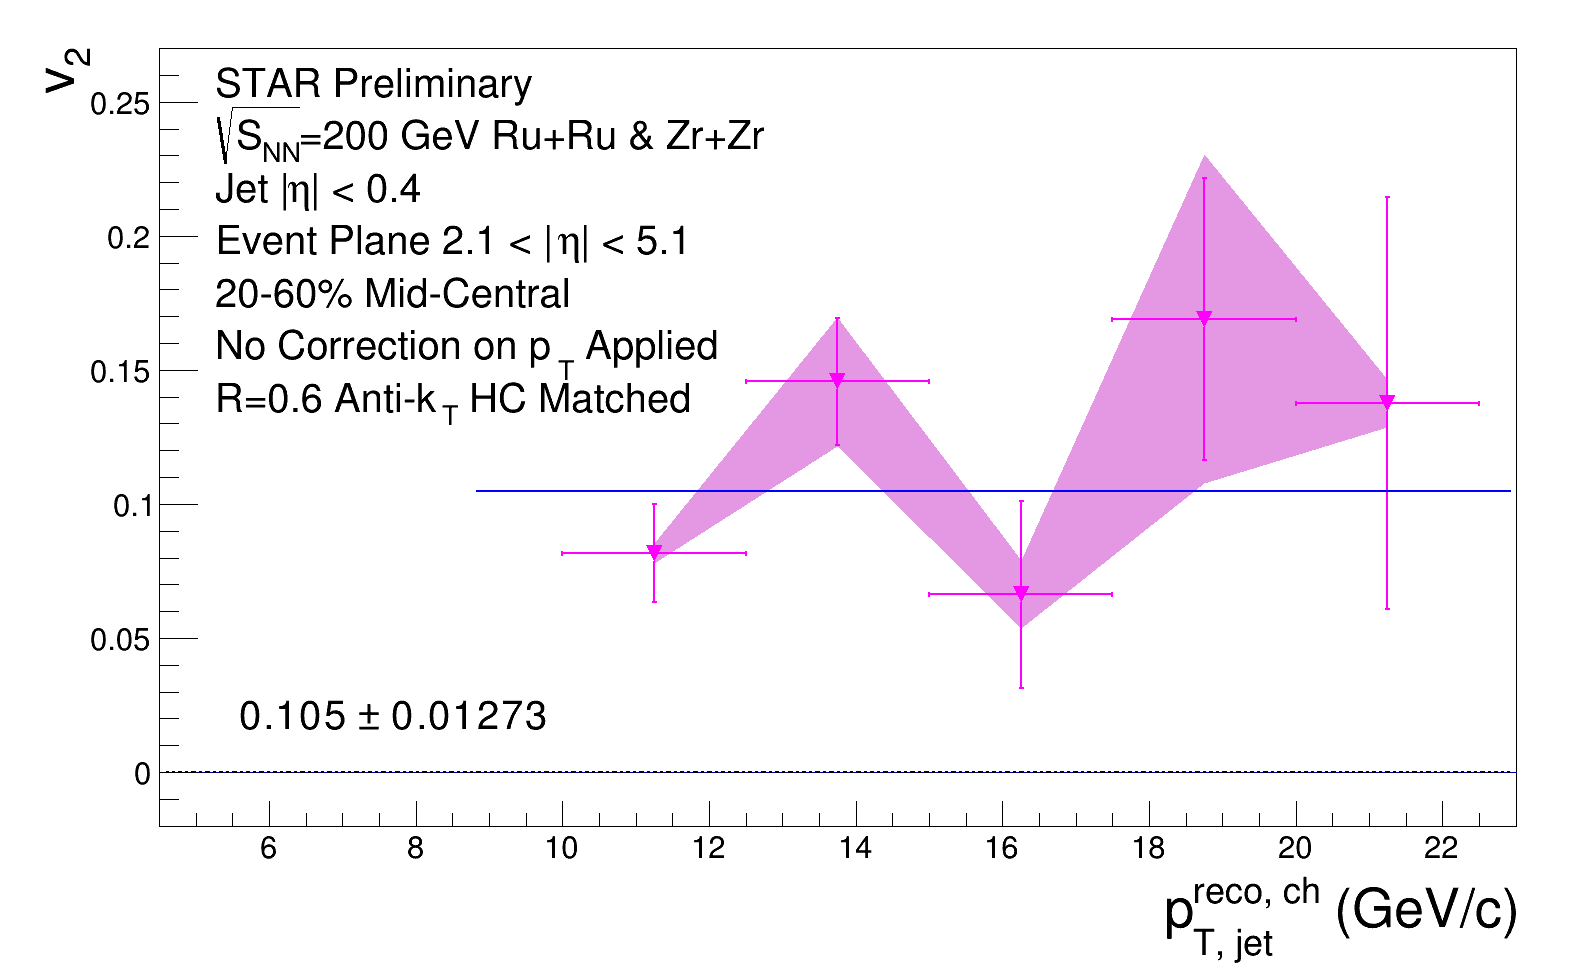
First, the overall jet v2:
And the ratio plot I intend to present:

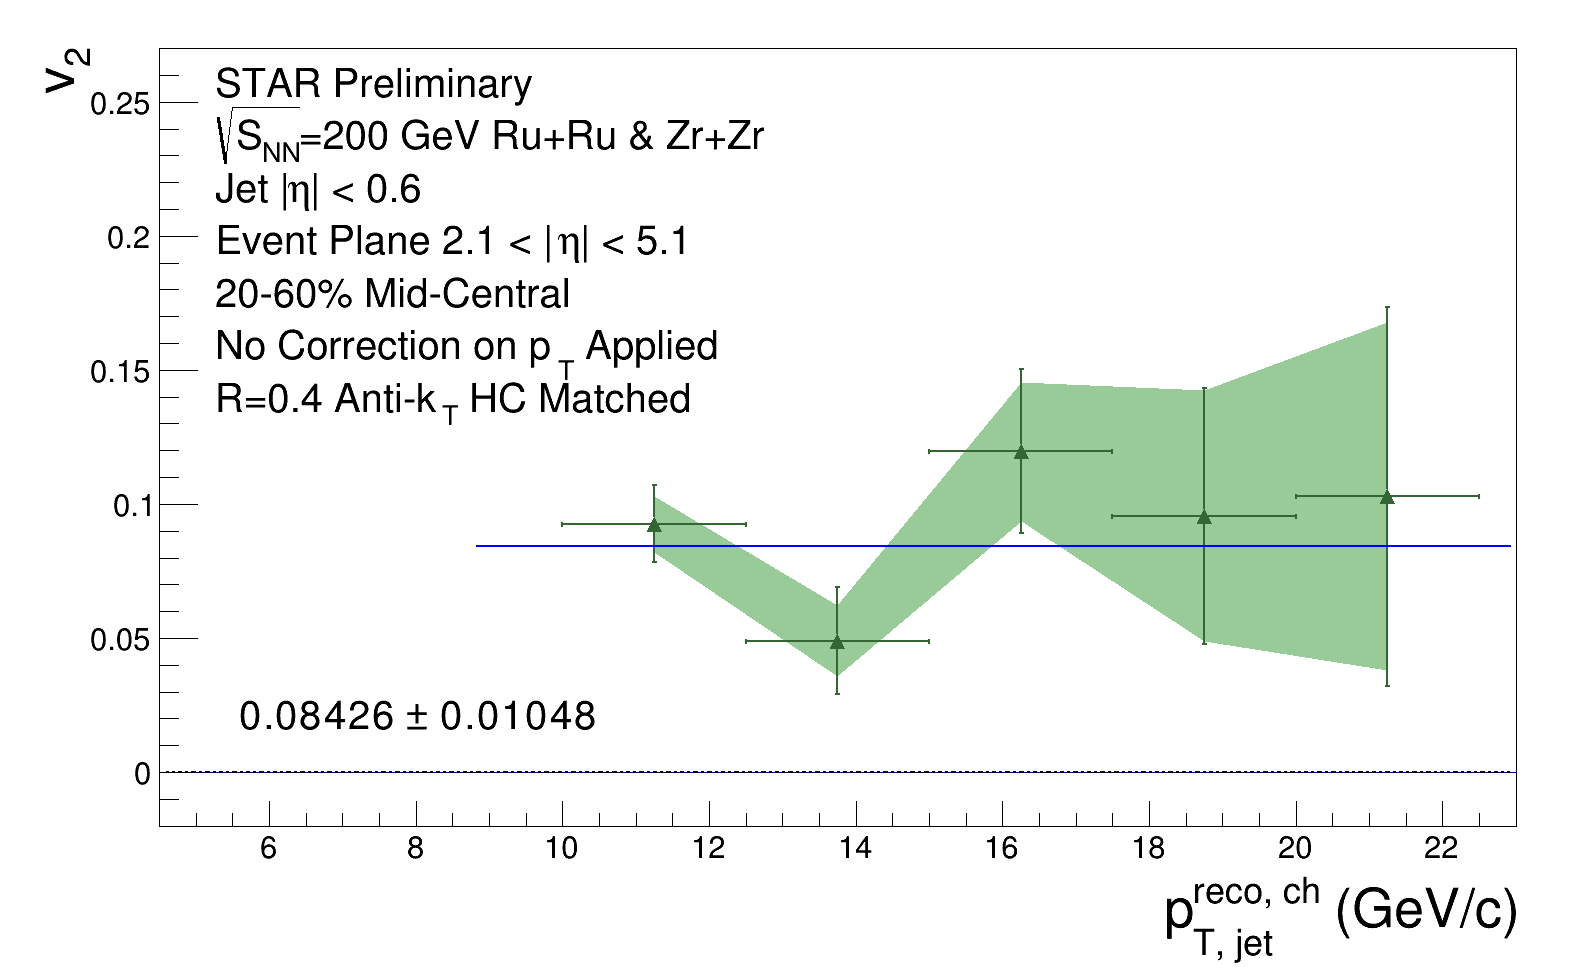
Next, the jet v2 for the denominator (Set A of the data). Please note that the systematics for these plots are not correctly calculated, only the statistical uncertainties are used in the fitting.
.png)
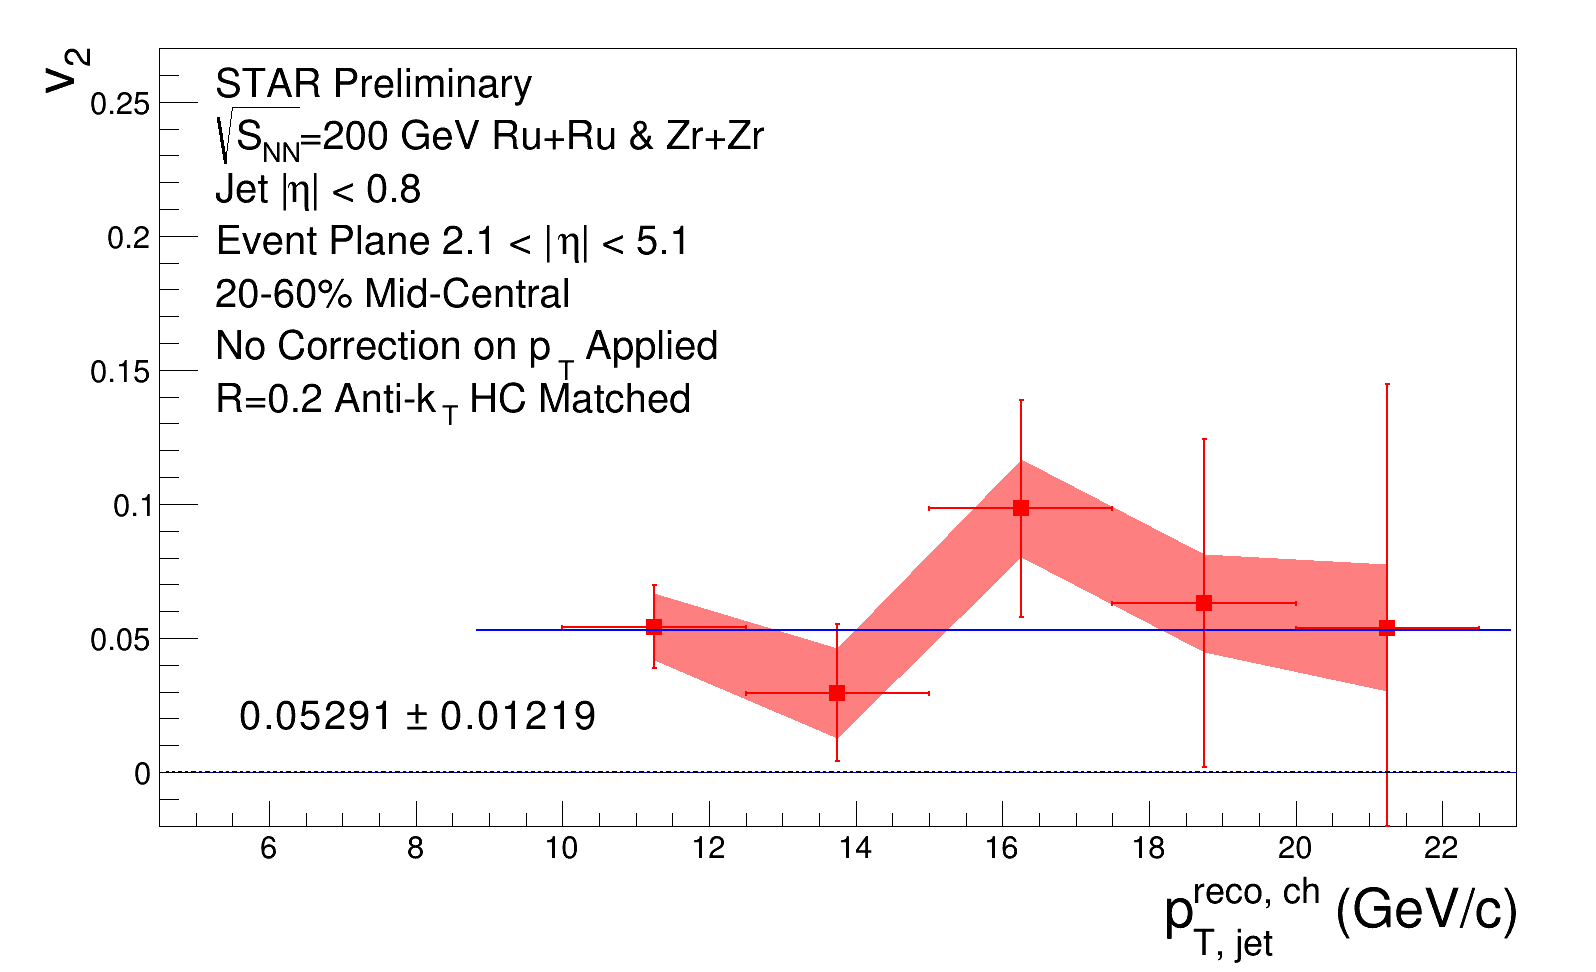
And from the other half of the data, the numerators (Set B of the data):
.png)
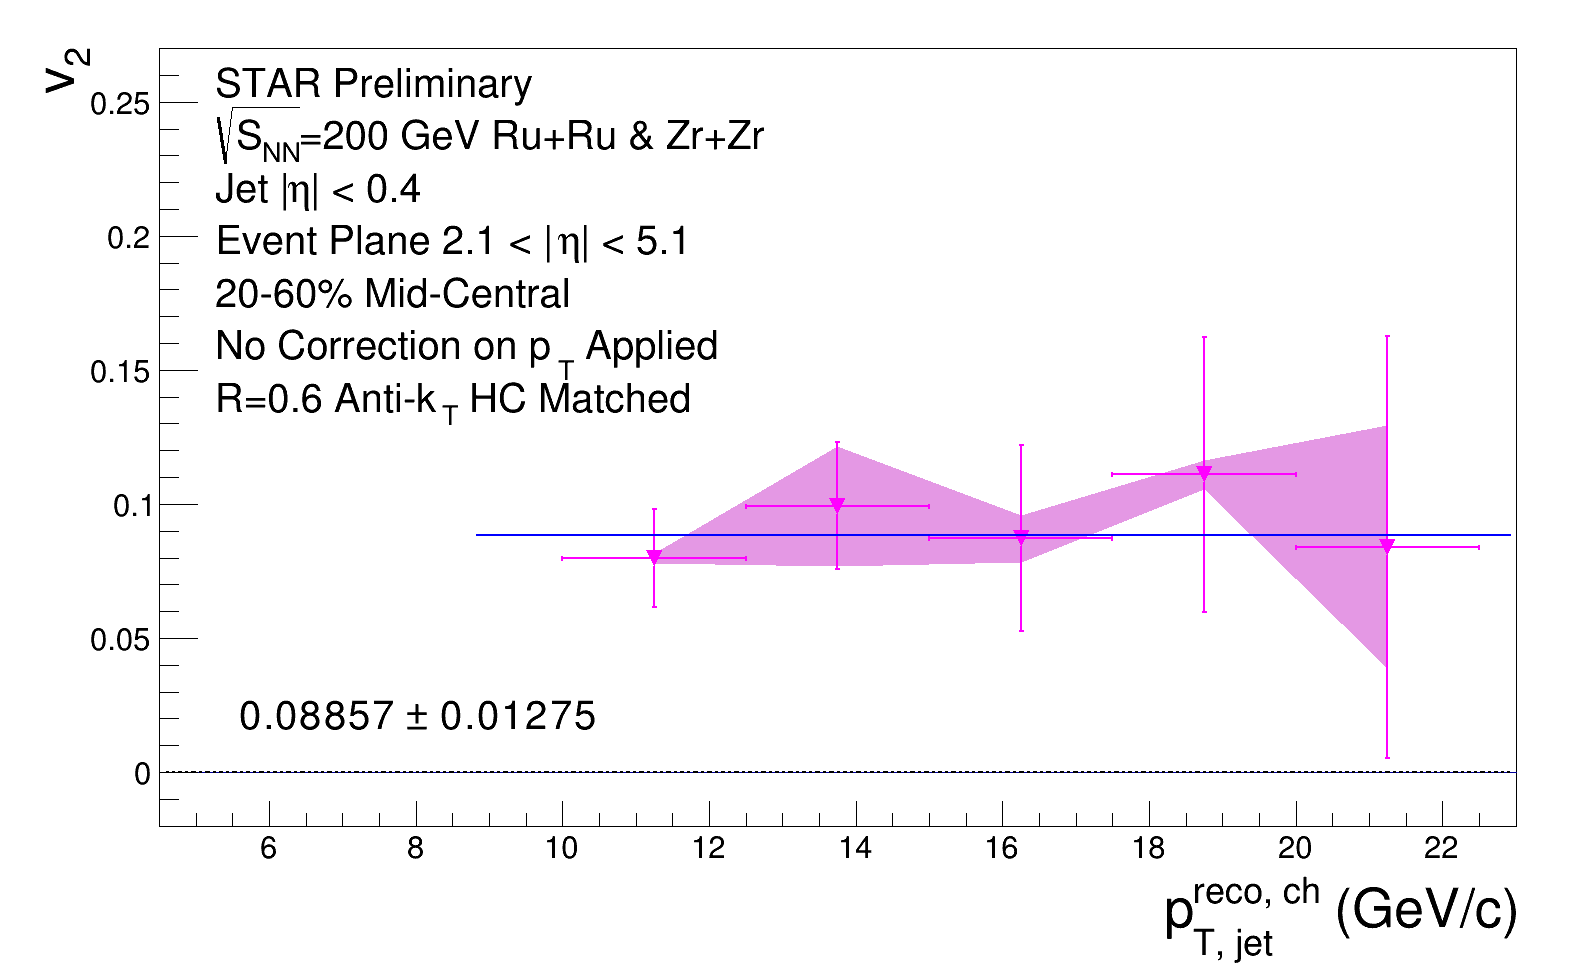
Interestingly, in set B of the data, the R=0.2 result moves considerably.
SET B OF DATA (NOT USED IN CALCULATION)
From set A, the R=0.4 and R=0.6 points do also move, but not as significantly.
SET A
- protzt's blog
- Login or register to post comments