SMD cut efficiency: data vs simulation
Comparison between SMD cut efficiency from 2005 data and 2005 embedded simulation.
SMD cut efficiency is defined as the ratio of electrons that pass all eID cuts (EMC matching, dE/dx, p/E, SMD cuts) to electrons that pass all cuts except SMD cut (EMC matching, dE/dx, p/E cuts).
For Sim: efficiency calculated using single electrons embedded into Pythia events. Simulation dataset RCF9065: 2005 pp, y2005g.
For Data: efficiency calculated using identified oppsosite sign (OS) photonic electrons (+ small amount of combinatorial, cannot be removed) as high purity electron sample. However, efficiency calculated using inclusive electron sample (lower purity, higher hadron contamination) shows similar efficiency.
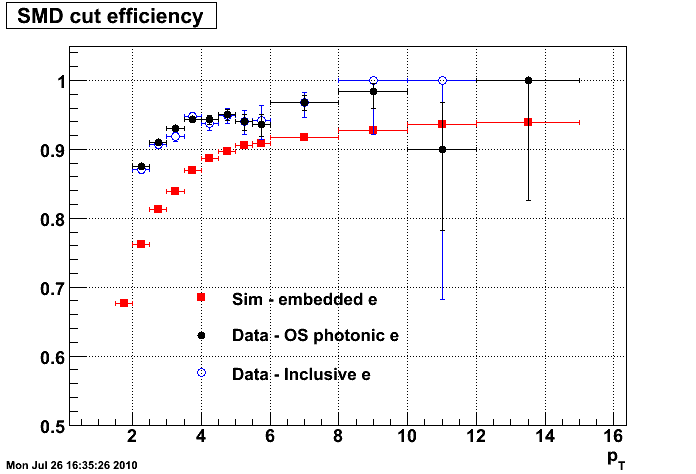
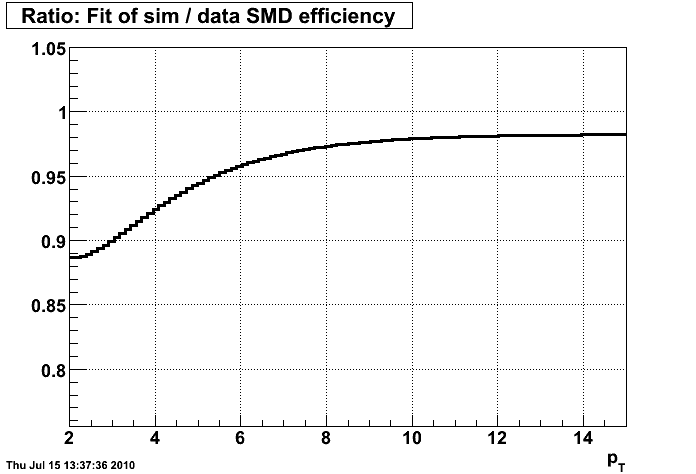
Result: Efficiency from simulation is found to be ~10% lower than efficiency from data, as shown below.
The ratio shown is the ratio of the fits of both efficiencies to the form [0]*(1-.5*exp(-(x-[1])/[2])).
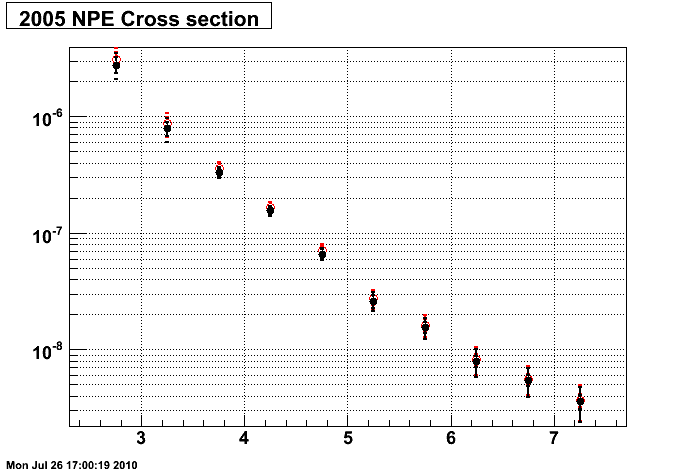
Gang applied this correction to UCLA's 2005 NPE cross section. The difference is visible in the lower pT, and negligible in the higher pT range. The new cross section is now more in-line with Purdue's 2008 NPE cross section.
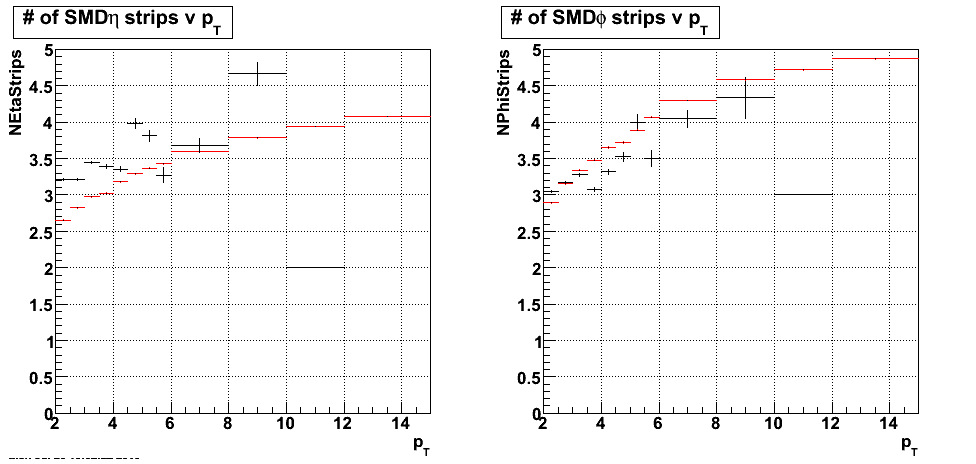
Looking closer at the SMD strips:
The average number of strips per pT bins show relative consistency between data (black) and sim (red) for phi plane, but not for lower pT of eta plane. This may contribute to lower efficiency in the simulation, but this alone can't explain the lower efficiency at higher pT.
Given strip # 4 as the highest energy strip in the smd cluster, the probability of neighboring strips to also fire is shown below. This hit frequency plot actually suggests that smd clusters in data are more likely to be narrower (lower probability for a hit in further neighboring hits) than in simulation, where the probability distribution of smd hits is broaders.

The energy distribution of the smd cluster also show the same trend, where a higher fraction of the cluster's energy is contained in the highest energy strip for the data, whereas in simulation the energy is more broadly divided among the smd strips.
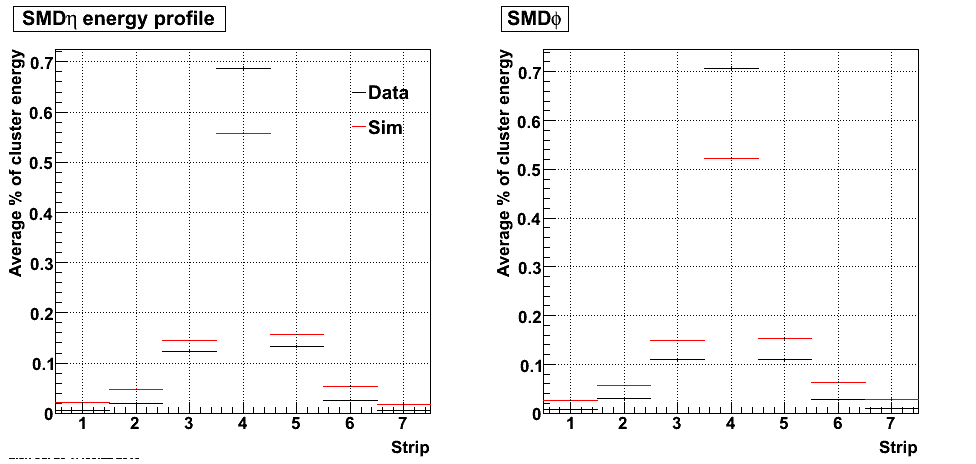
Conclusion: Difference in SMD cut efficiency between data and simulation measured, and correction applied to NPE cross section. However, the underlying cause of the difference is still unknown. There are differences in how the energy is distributed in the SMD strips, but they suggest broader SMD clusters in simulation, not narrower. On first glance, it's unclear how that corresponds to lower efficiency.
Follow up: Energy distribution by strip
- kurnadi's blog
- Login or register to post comments