- jlzhang's home page
- Posts
- 2024
- March (1)
- 2022
- 2021
- December (1)
- 2019
- April (1)
- 2018
- 2017
- 2016
- 2015
- December (1)
- November (1)
- September (3)
- August (1)
- May (1)
- April (1)
- March (4)
- February (5)
- January (3)
- 2014
- December (4)
- November (4)
- October (2)
- September (3)
- August (4)
- July (3)
- June (4)
- May (2)
- April (1)
- March (2)
- February (2)
- January (1)
- 2013
- My blog
- Post new blog entry
- All blogs
Discrepancy between data and MC in background estimation -- II
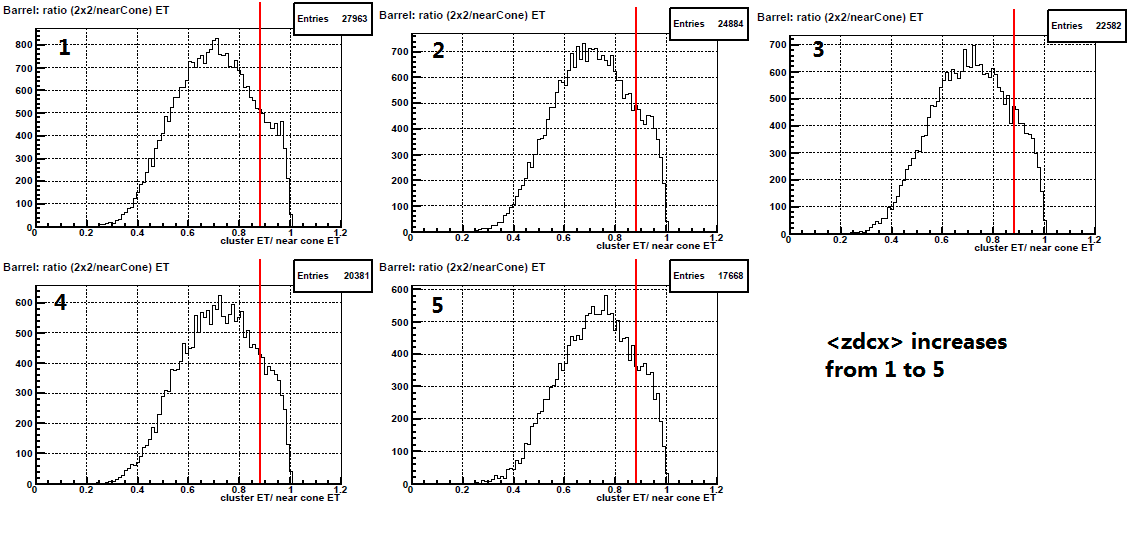
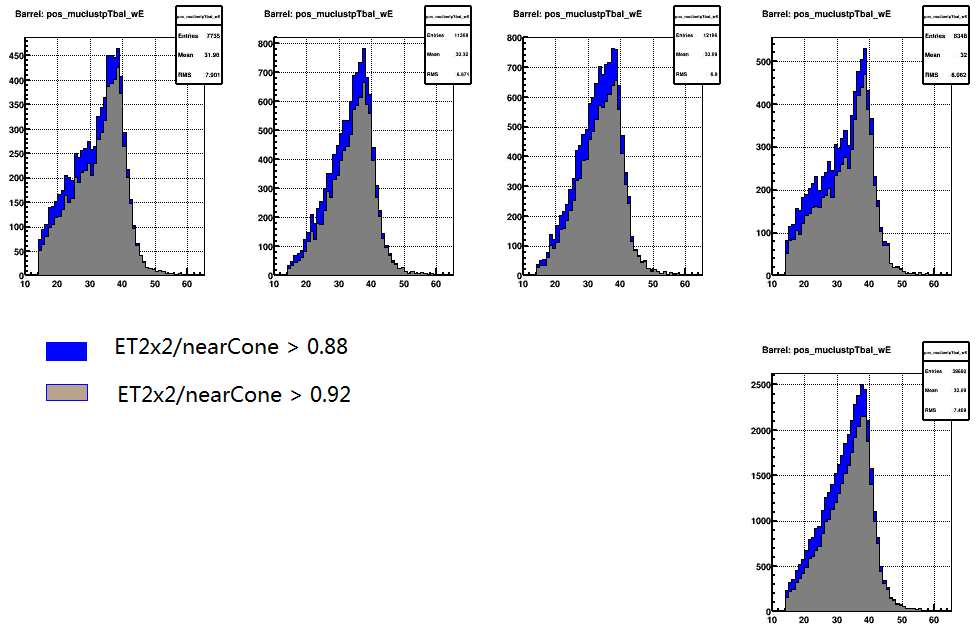
We have noted that the discrepancy between data and embedding has lumnosity dependence. After comparing the QA plots from different lumnosity runs, we see an indication that the ratio of ET(2x2)/nearCone is changed for different luminosity runs. Based on our previous knowlegde, we can see from below plots that the efficiency of this isolation cut reduce significantly for high luminosity runs.
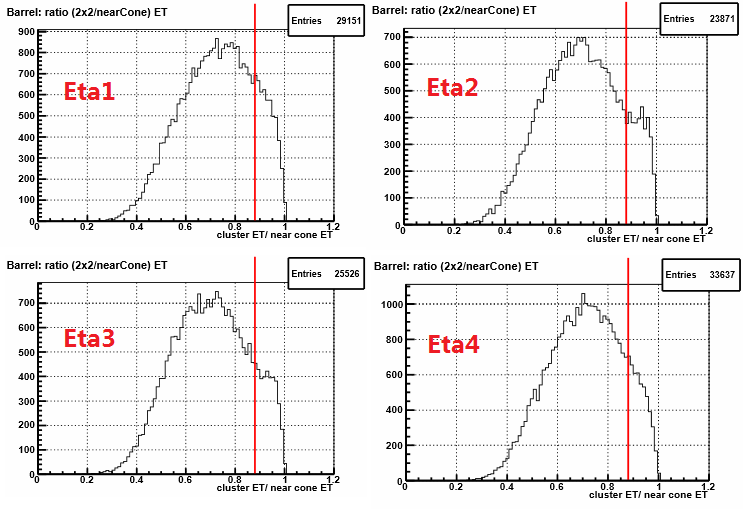
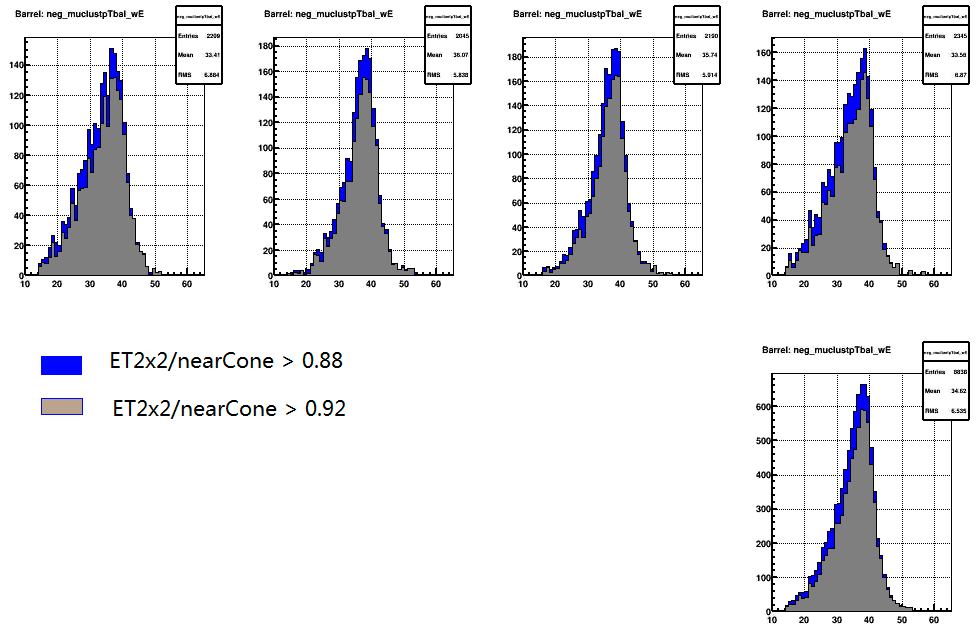
Additional, it seems that this distribution also has eta dependence. We can see this in below plots.
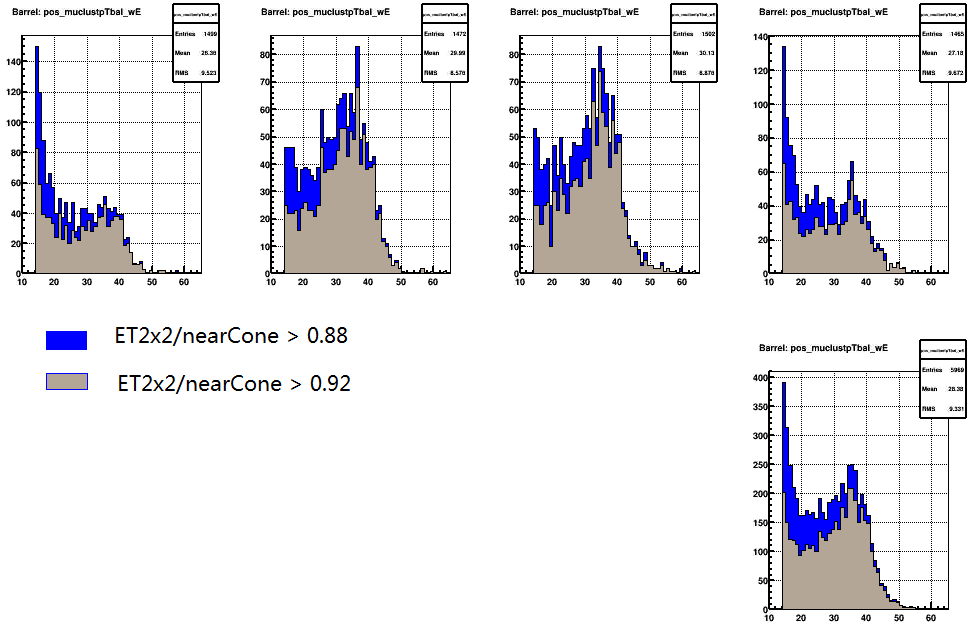
From above indications, I modified the threshold for this isolation cut. And re-run the analysis code for both Data and embedding smaple. Here is the ET distribution before and after modifying the cut from 0.88 to 0.92.
W+ :
W-:
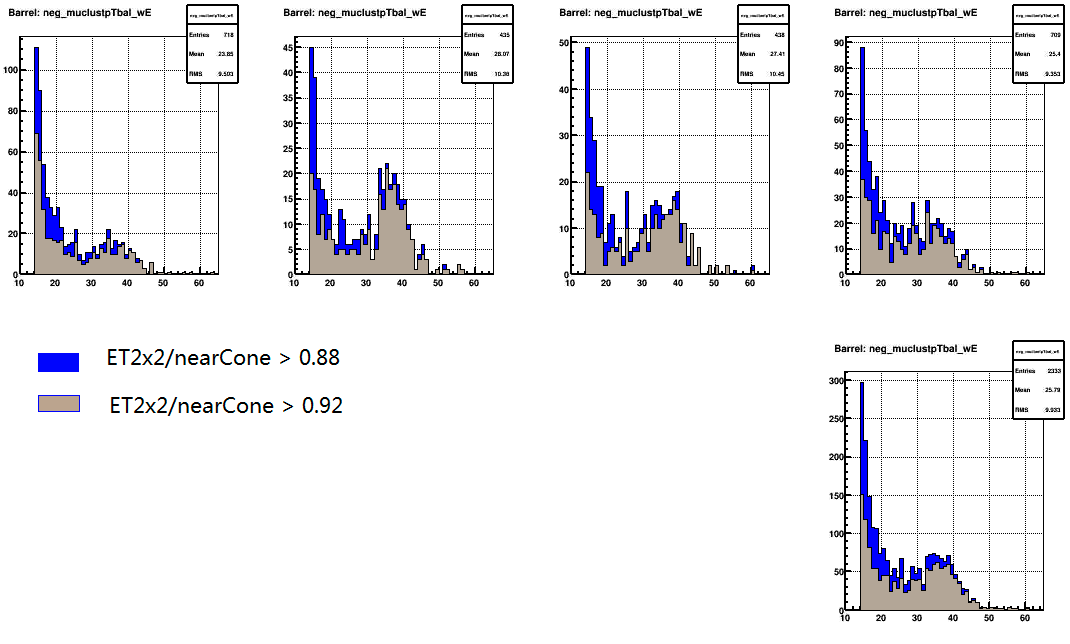
We can see that there are significantly impact on the raw signal shape.
And for embedding W+:
embedding W-:
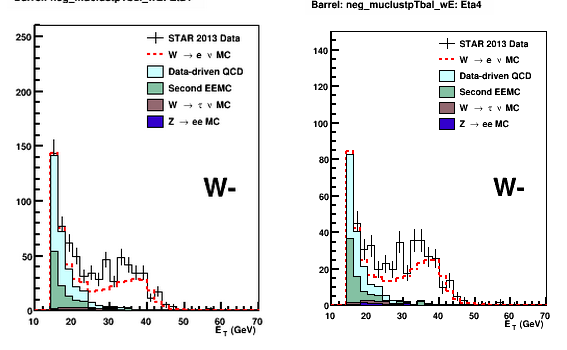
Below are the background estimaiton plots.


The discrepancy looks smaller, but still there, especially for eta4 W-.
ET2x2/ nearCone > 0.88 ET2x2/nearCone > 0.92
Groups:
- jlzhang's blog
- Login or register to post comments