- jlzhang's home page
- Posts
- 2024
- March (1)
- 2022
- 2021
- December (1)
- 2019
- April (1)
- 2018
- 2017
- 2016
- 2015
- December (1)
- November (1)
- September (3)
- August (1)
- May (1)
- April (1)
- March (4)
- February (5)
- January (3)
- 2014
- December (4)
- November (4)
- October (2)
- September (3)
- August (4)
- July (3)
- June (4)
- May (2)
- April (1)
- March (2)
- February (2)
- January (1)
- 2013
- My blog
- Post new blog entry
- All blogs
Discrepancy between data and MC in background estimation
As the analysis moving on, we did the background estimaiton. However we saw significant discrepancy between the data shape and the MC shape.
.png)
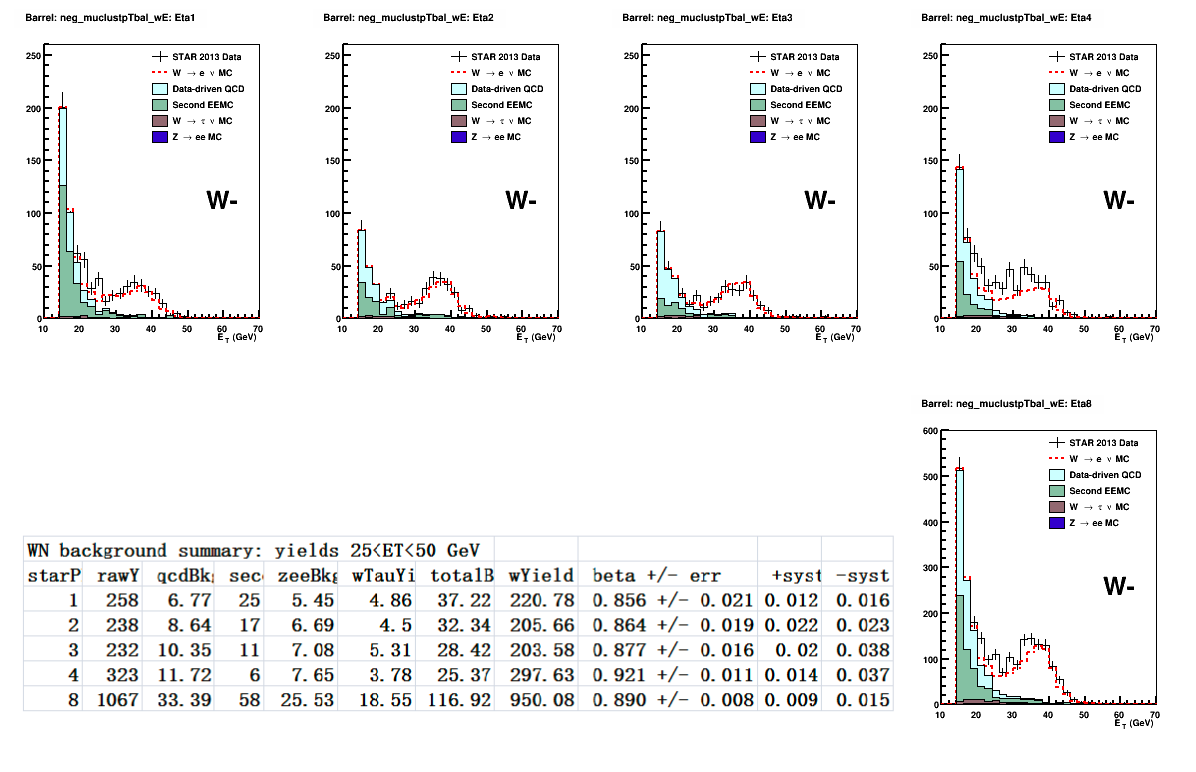
To study the reason case this difference, I did the study for below several possible reasons.
1. We have 26 runs which don't have zerobias events, so they are not included into the produced embedding sample. But their fraction is only ~3%. They have no chance to impact the data shape so much.
2. The ZDC rate of run13 is higher than run12. Maybe our analysis in high luminosity range is not as good as we expected. To confirm this, I divided all the good runs into 5 groups according to their ZDC rate. Below is the comparison between the first two groups with low zdcx rate and the last two groups with high zdcx rate.
-> Low zdcx rate, W+

-> High zdcx rate, W+

-> Low zdcx rate, W-

-> High zdcx rate, W-

From above plots comparison, we can see the indication that the high lumnosity runs dominate the discrepancy. We should pay more attention here.
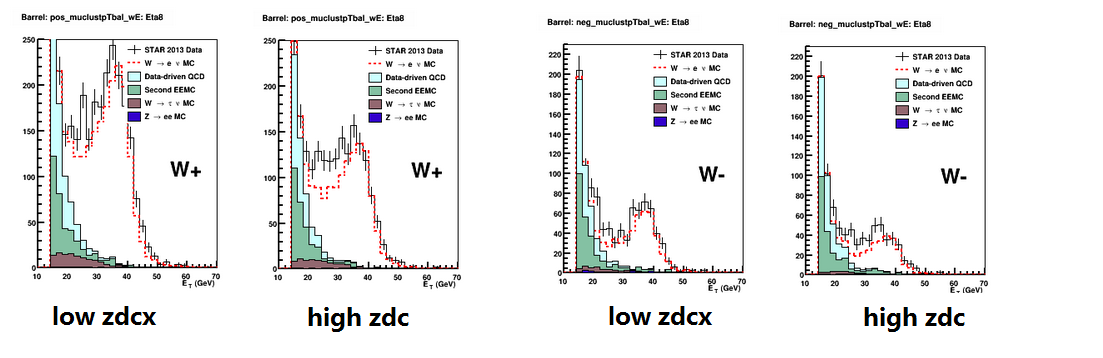
Detail plot can be found here. where the smaller numbers after "p" stand for the lower zdc rate.
3. There are 74 runs have 30%eemc off. Here is the background estimaiton for those runs. It seems those runs also doesn't contribute so much for the discrepancy.


Groups:
- jlzhang's blog
- Login or register to post comments