- genevb's home page
- Posts
- 2025
- 2024
- 2023
- 2022
- September (1)
- 2021
- 2020
- 2019
- 2018
- 2017
- December (1)
- October (3)
- September (1)
- August (1)
- July (2)
- June (2)
- April (2)
- March (2)
- February (1)
- 2016
- November (2)
- September (1)
- August (2)
- July (1)
- June (2)
- May (2)
- April (1)
- March (5)
- February (2)
- January (1)
- 2015
- December (1)
- October (1)
- September (2)
- June (1)
- May (2)
- April (2)
- March (3)
- February (1)
- January (3)
- 2014
- 2013
- 2012
- 2011
- January (3)
- 2010
- February (4)
- 2009
- 2008
- 2005
- October (1)
- My blog
- Post new blog entry
- All blogs
Quick plots of GridLeak model impact on Run 17 st_W
Updated on Wed, 2017-10-04 13:13. Originally created by genevb on 2017-10-04 13:06.
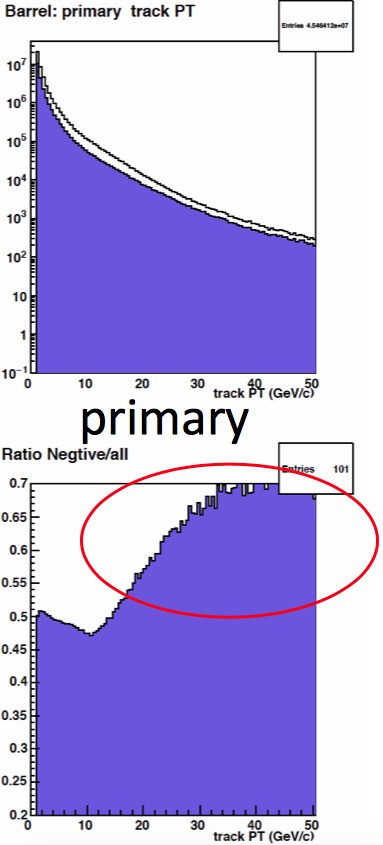
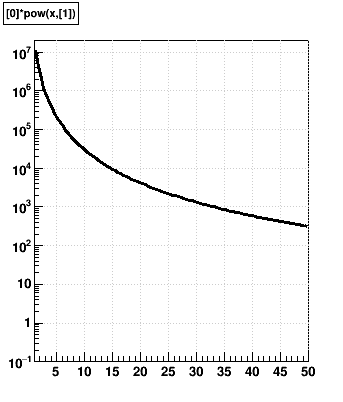
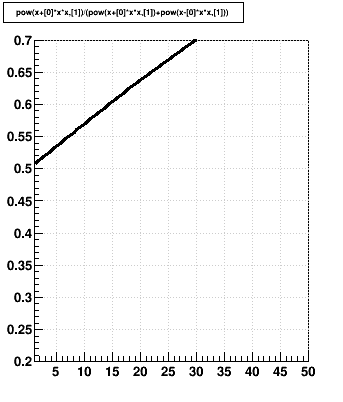
Anomalous behavior of the ratio of counts of high pT particles as a function of charge sign have been seen in the initial attempt to produce Run 17 st_W stream data for the W analysis (P17ig). This was shown in slide 4 of You do not have access to view this node. I have included the relevant pT distributions of high pT primary tracks in the left plots below. In the upper right, I have tried to make a simple representation of the primary track pT distribution as A*pTB, with A=2e7, B=-2.83. In the lower right, I have used the interpreted impact of GridLeak models on primary tracks of δ(pT) = 0.005*pT2 to demonstrate the impact on h-/(h- + h+).
A few comments:
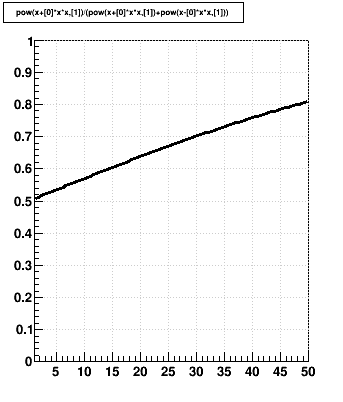
Here is another version of the lower right plot from above, but with minima and maxima expanded to [0,1]:
-Gene
A few comments:
- The real data is clearly not a perfect power law (particularly at low pT), so my simple model is not a very accurate replication, but is at least loosely illustrative.
- I am uncertain I have the sign of the impact correct for whether h-/(h- + h+) increases or decreases when switching models - I have simply chosen a sign to match that of the observation in real data.
- There should be an even larger impact on global tracks, but the real data did not show much of an issue for global tracks.
 |
 |
 |
Here is another version of the lower right plot from above, but with minima and maxima expanded to [0,1]:
-Gene
»
- genevb's blog
- Login or register to post comments