Run 9 Dijet Detector-level/Particle-level Simu Comparisons
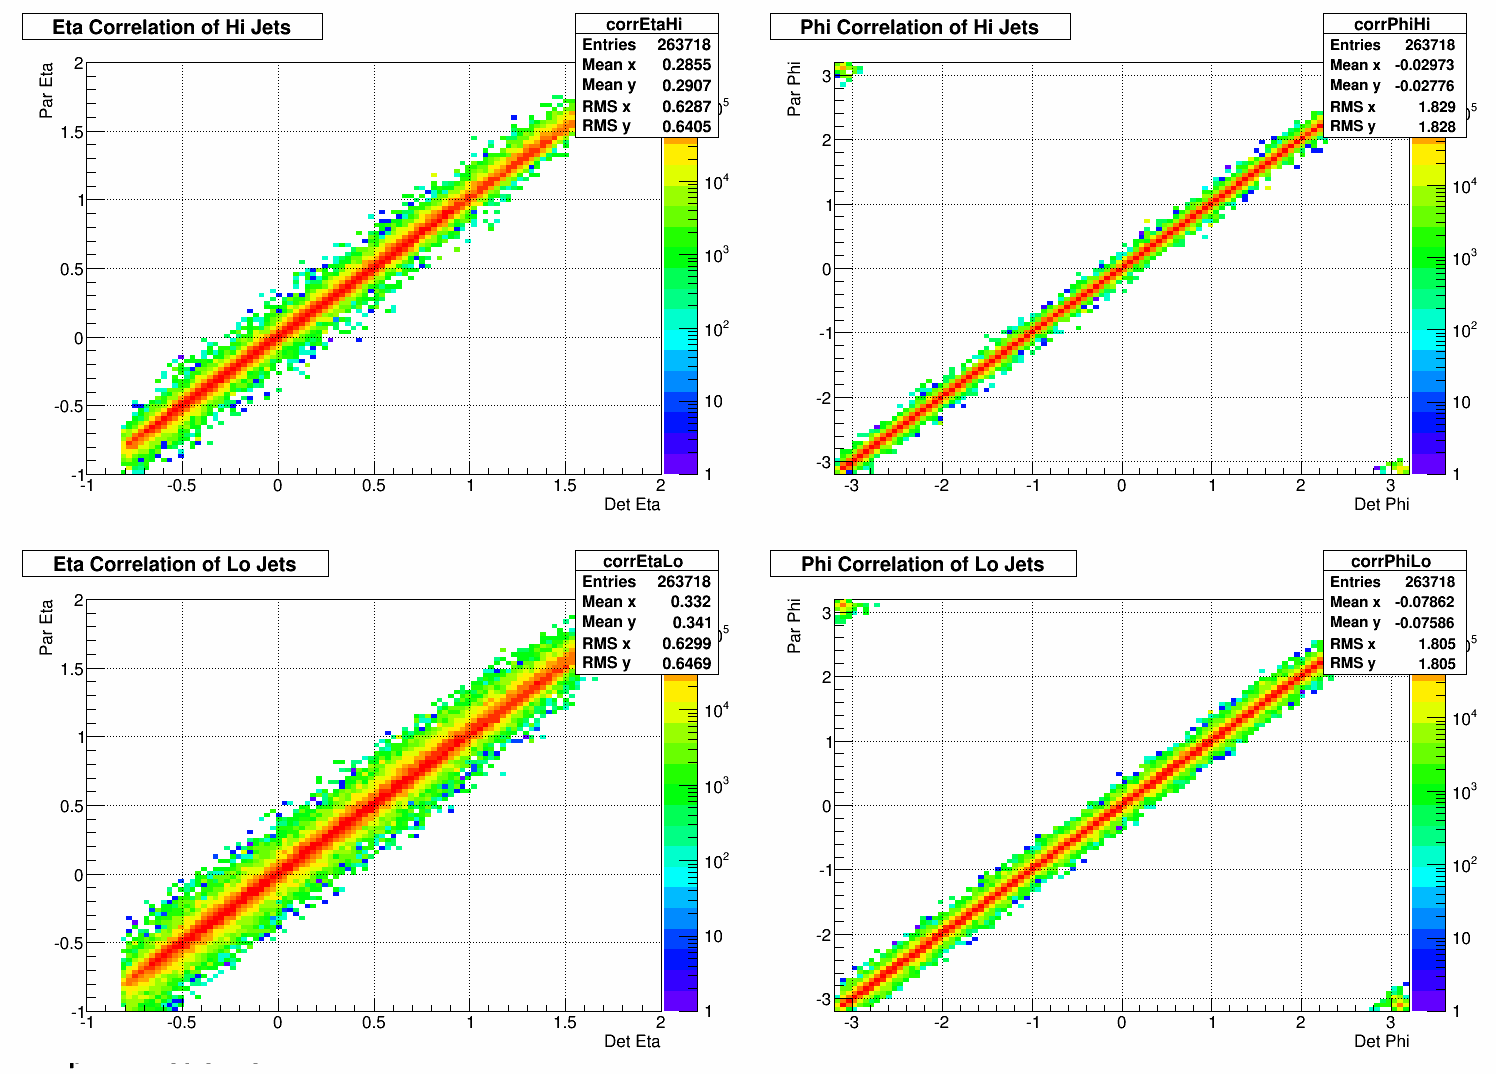
Matching cut: Detector-level and particle-level jets had to be within a certain range of eta/phi in order to be included in the histograms below. (Events not passing sqrt((delta eta)^2+(delta phi)^2) < .5 were thrown out.)
Correlation plots
.png)
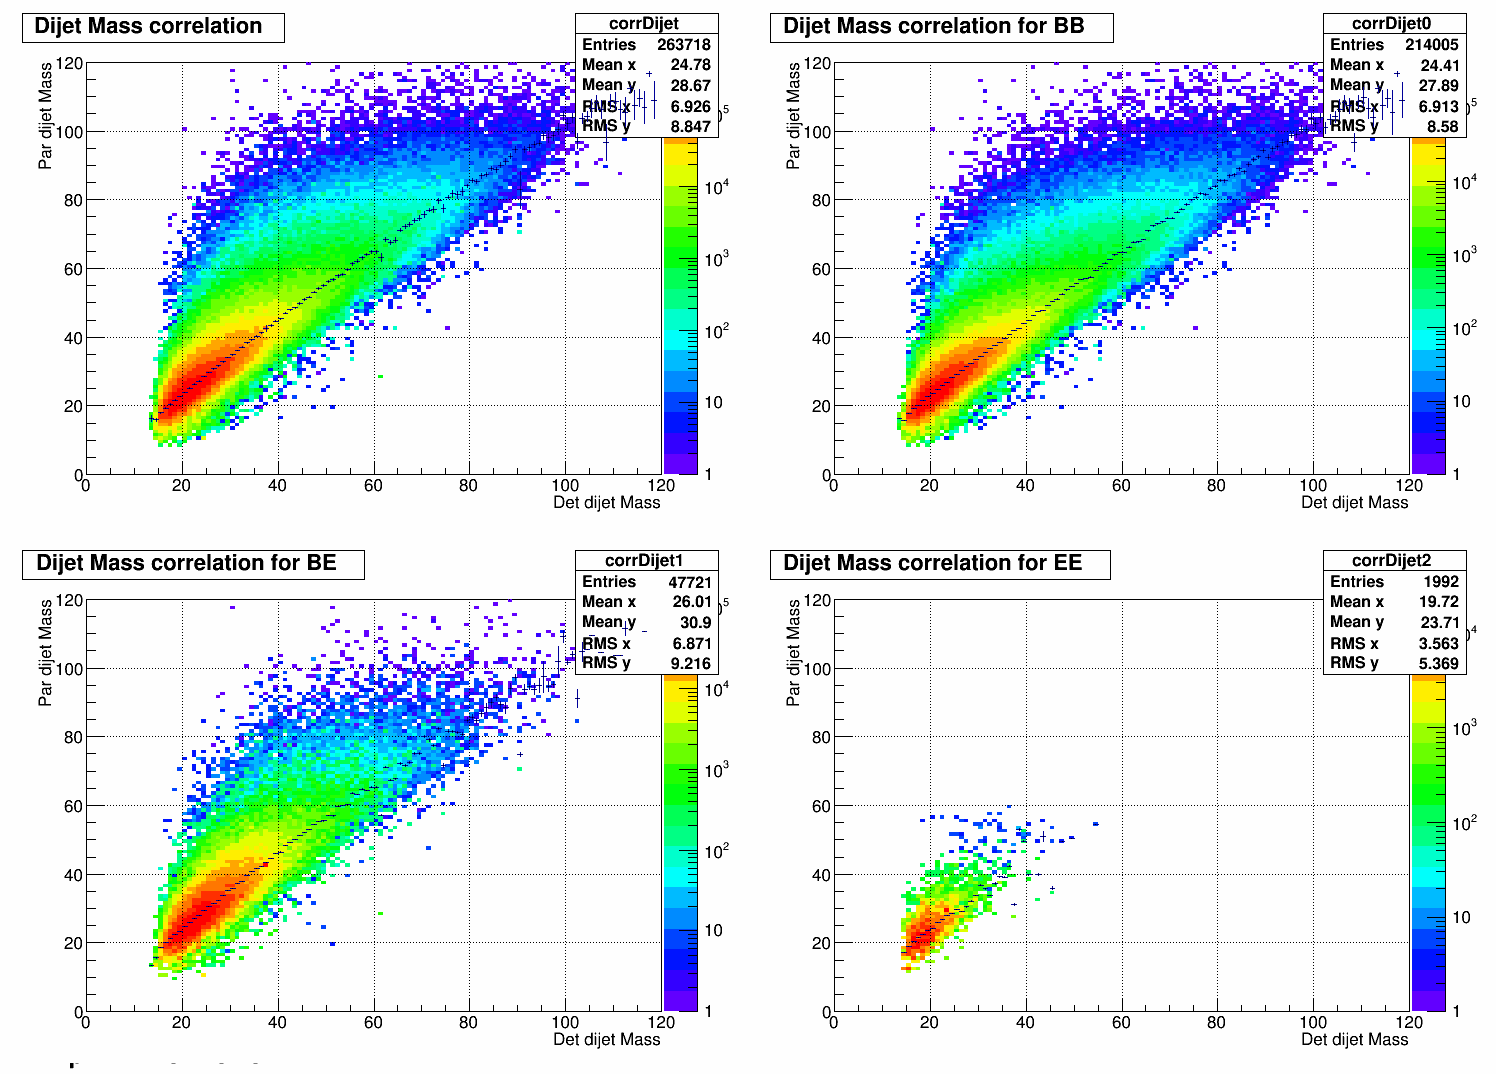

The plot above combines the correlation profiles for the barrel-barrel, barrel-endcap, and endcap-endcap dijet masses.
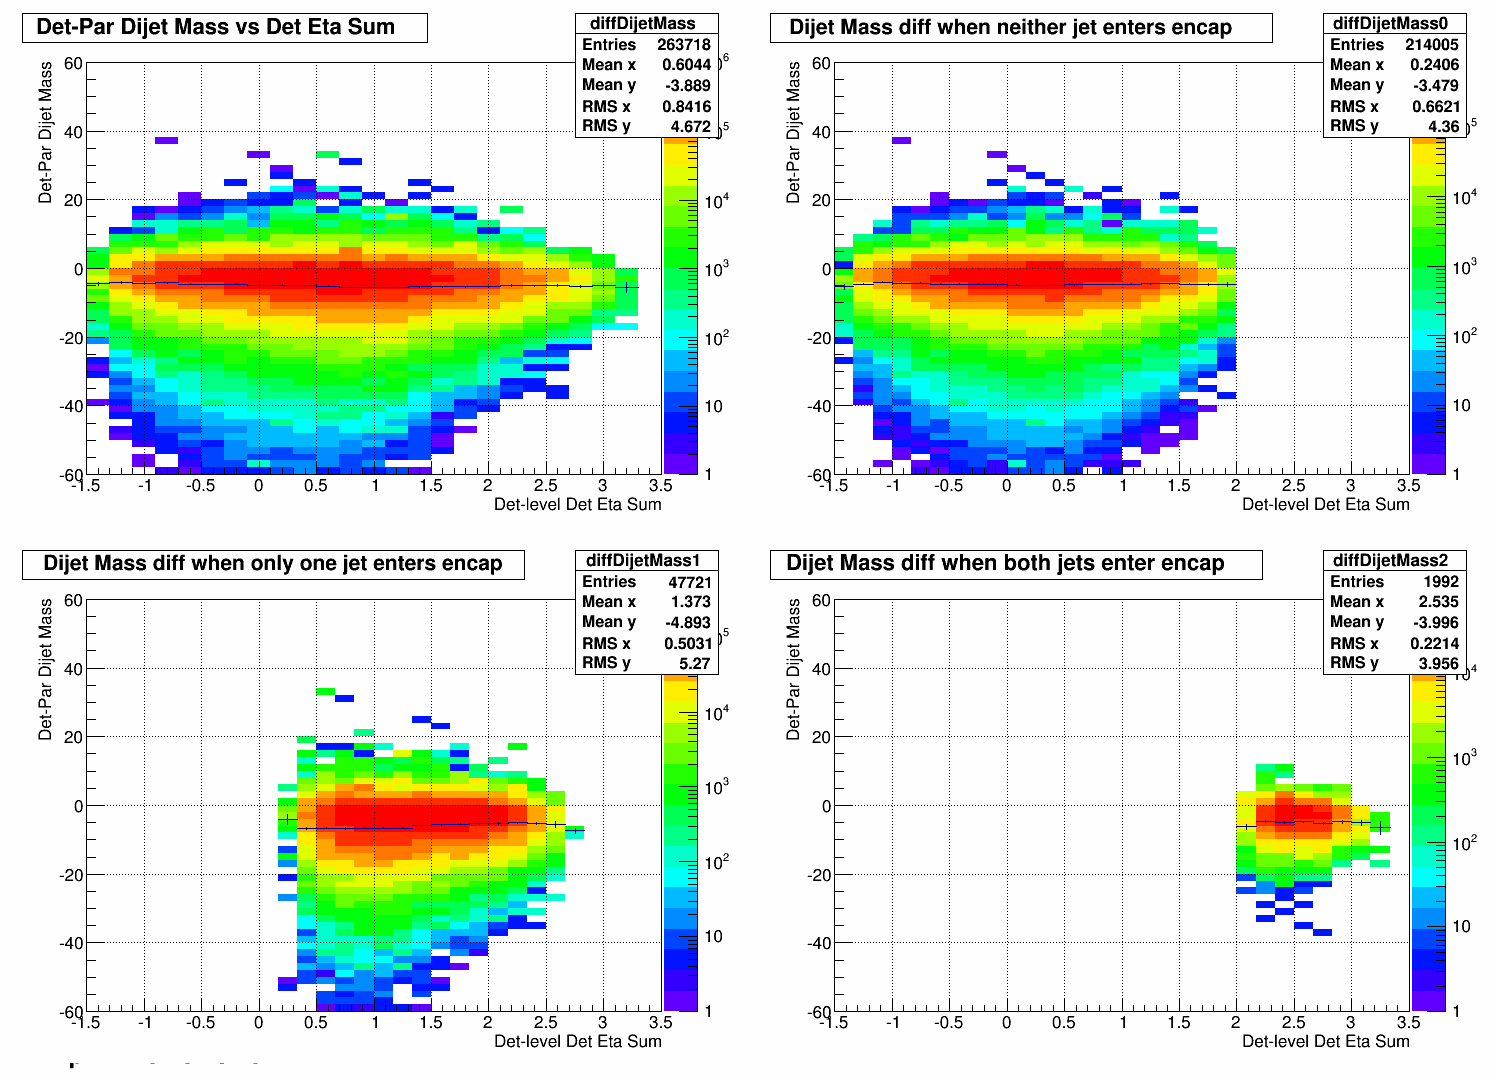
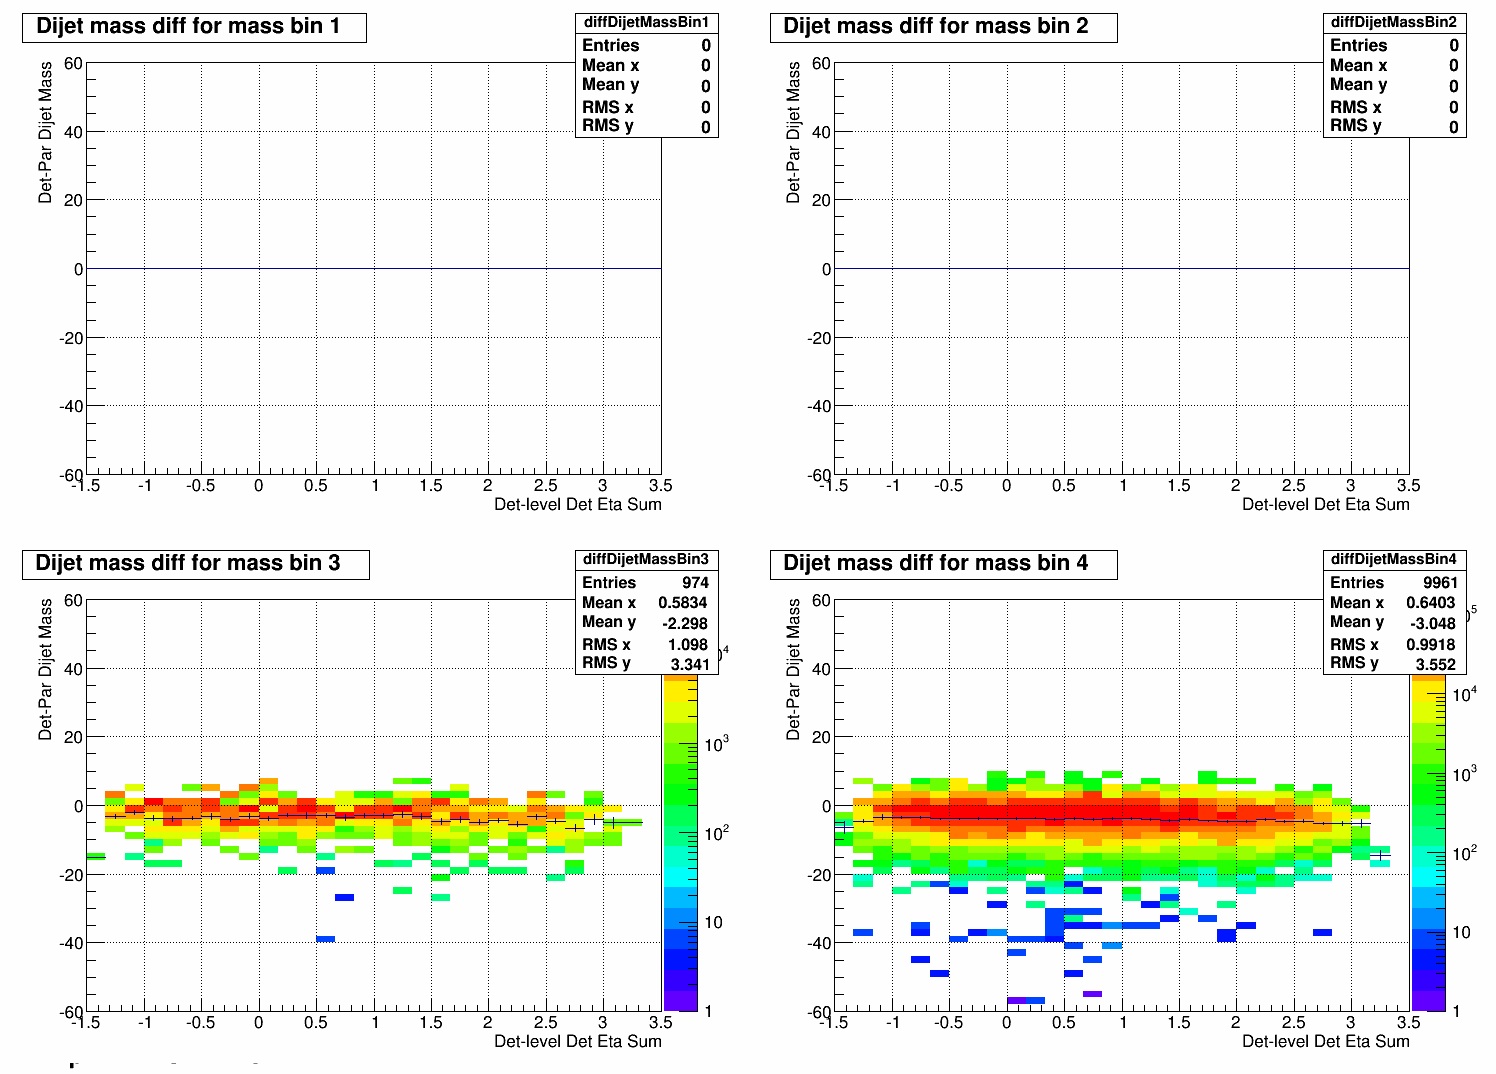
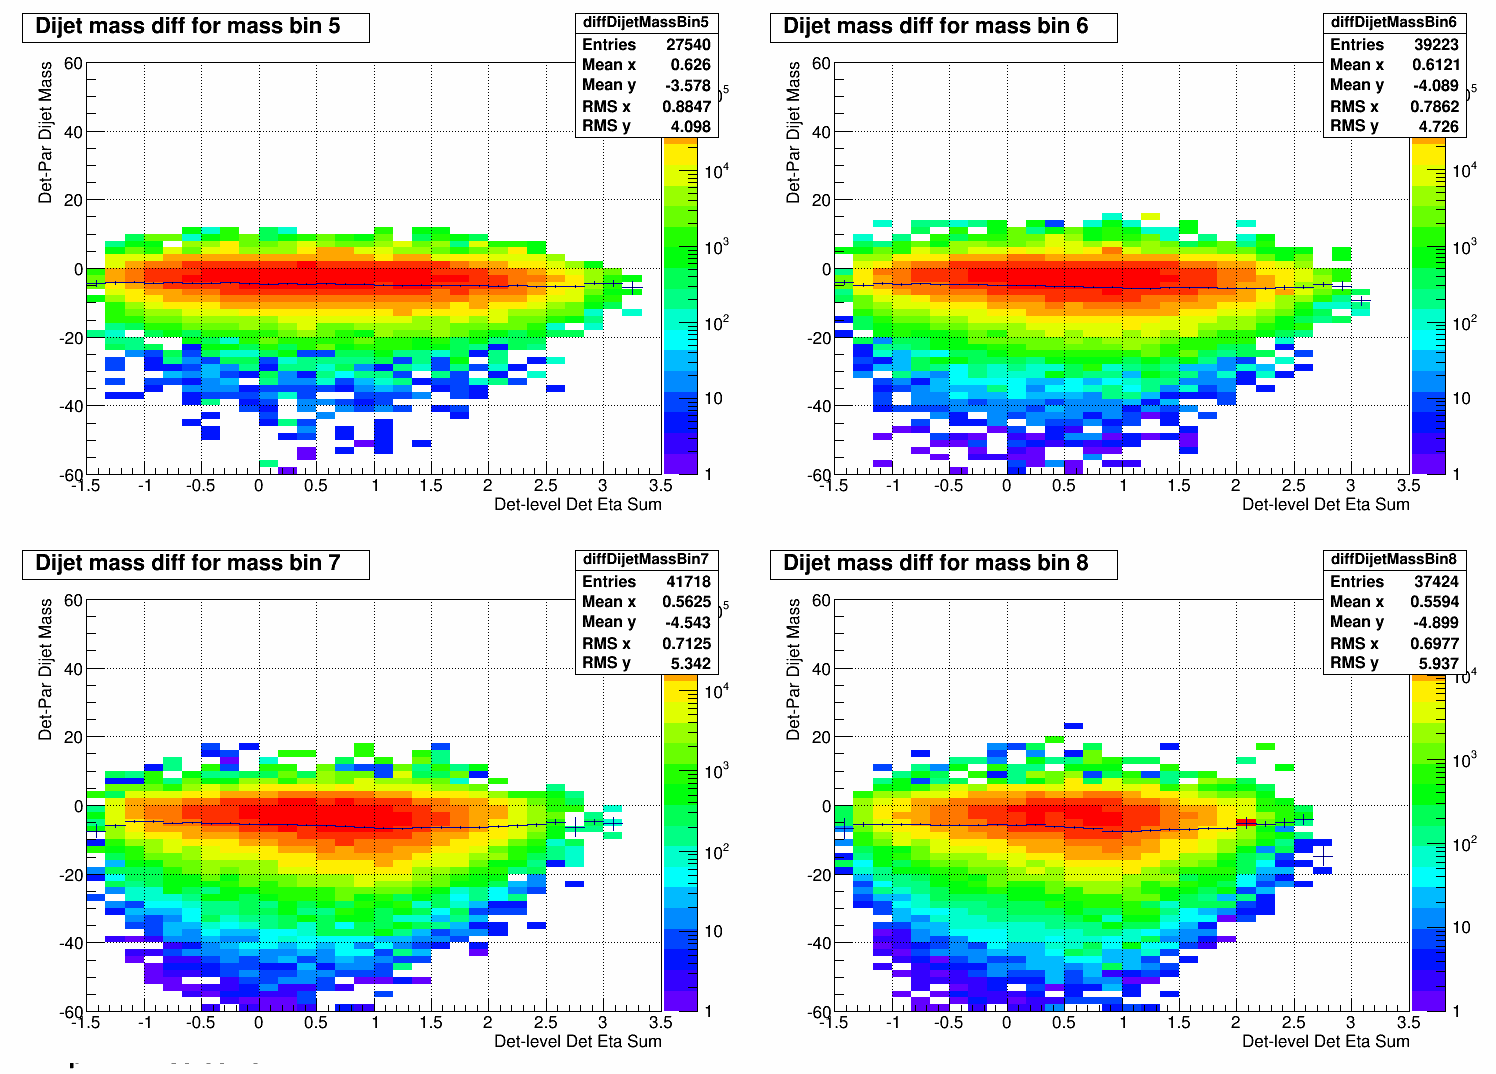
Dijet mass difference for each mass bin (I know this is a lot of plots; more succinct "summary plots" on the way)
Mass binning: {7,10,13,16,19,23,28,34,41,49,58,69,82,100} where
Bin 1 : 7 <= dijet mass < 10
Bin 2 : 10 <= dijet mass < 13
...
Bin 13 : 82 <= dijet mass < 100
Bin 14 : 100 <= dijet mass

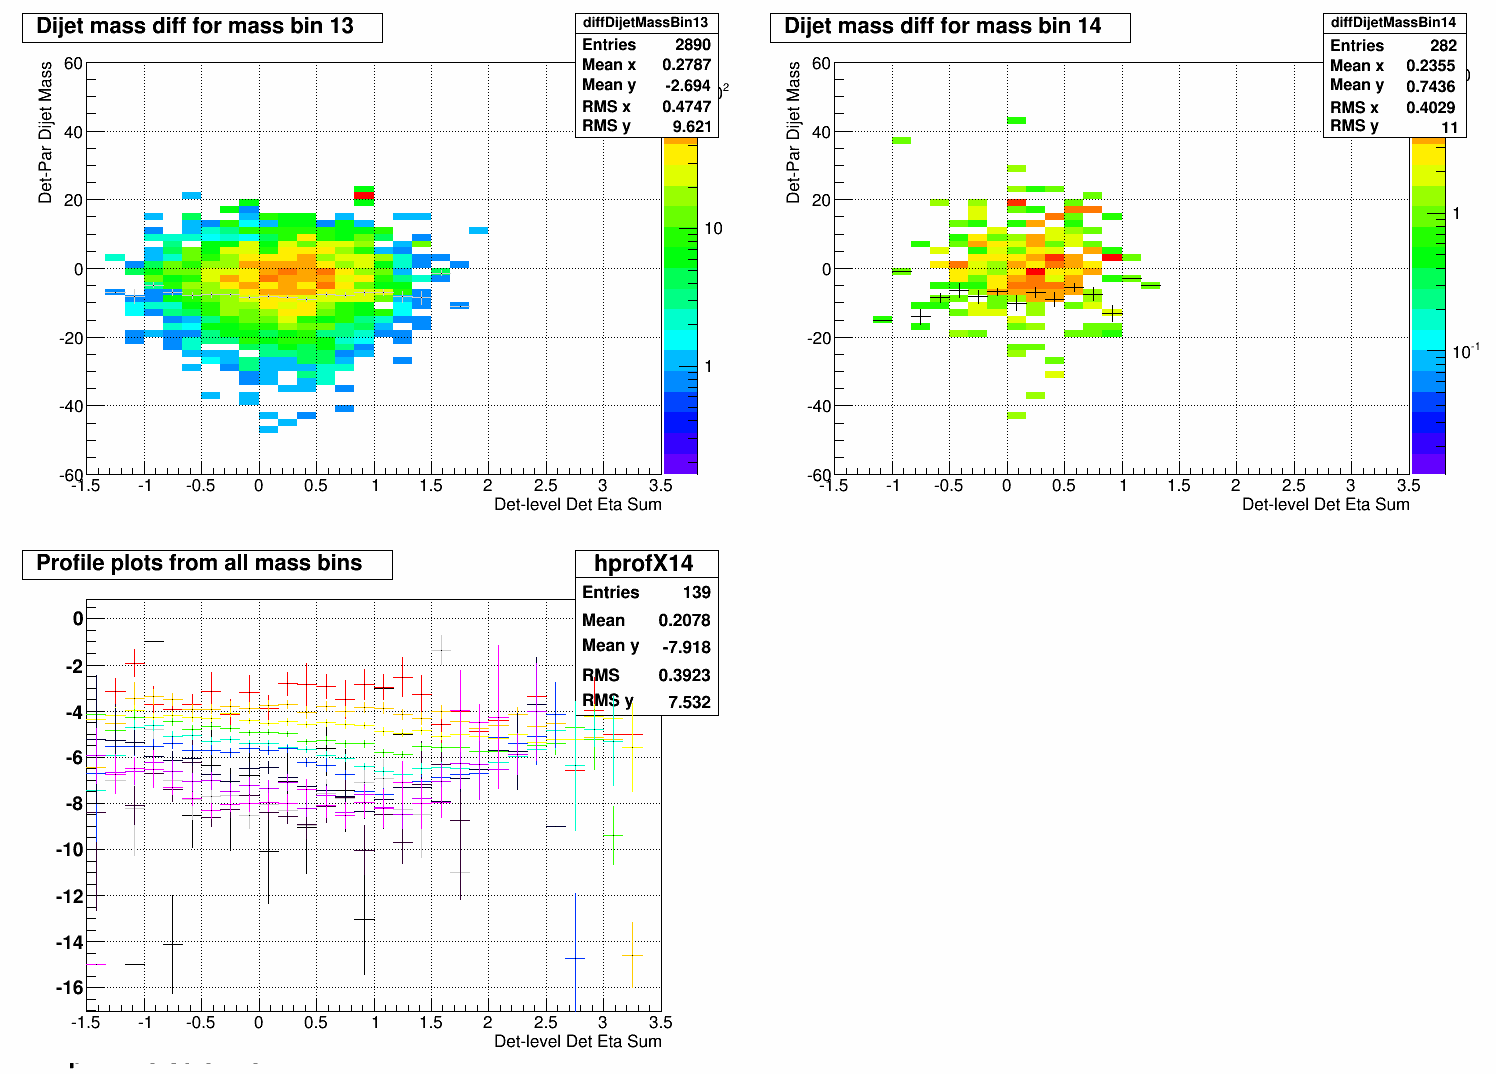
The final plot combines all mass bins. (Bins 1 and 2 omitted as they are empty. Red is mass bin 3, orange is mass bin 4, .... gray is mass bin 13, black is mass bin 14.) Two things to point out here: 1. Similar to what we see in the correlation plots, the particle-level dijet mass diverges further from detector-level dijet mass as we look at larger mass bins. 2. This effect as a function of eta sum is
- ezarndt's blog
- Login or register to post comments