Run 9 Dijet Data/Simu Comparisons
The following plots are from comparing data (running over all dijet trees from run 9) and detector-level simulation (all events in trigger filter sample).
The first set of histograms in each section are for all dijets, and then these same quantities are broken into barrel and endcap. The last plots are broken down into dijets that had both jets in the barrel, dijets that had one jet in the barrel and one jet in the endcap, and dijets that had both jets in the endcap. All plots were normalized by scaling the simulation histogram by the ratio (integral of z vertex plot from data)/(integral of z vertex plot from simu).
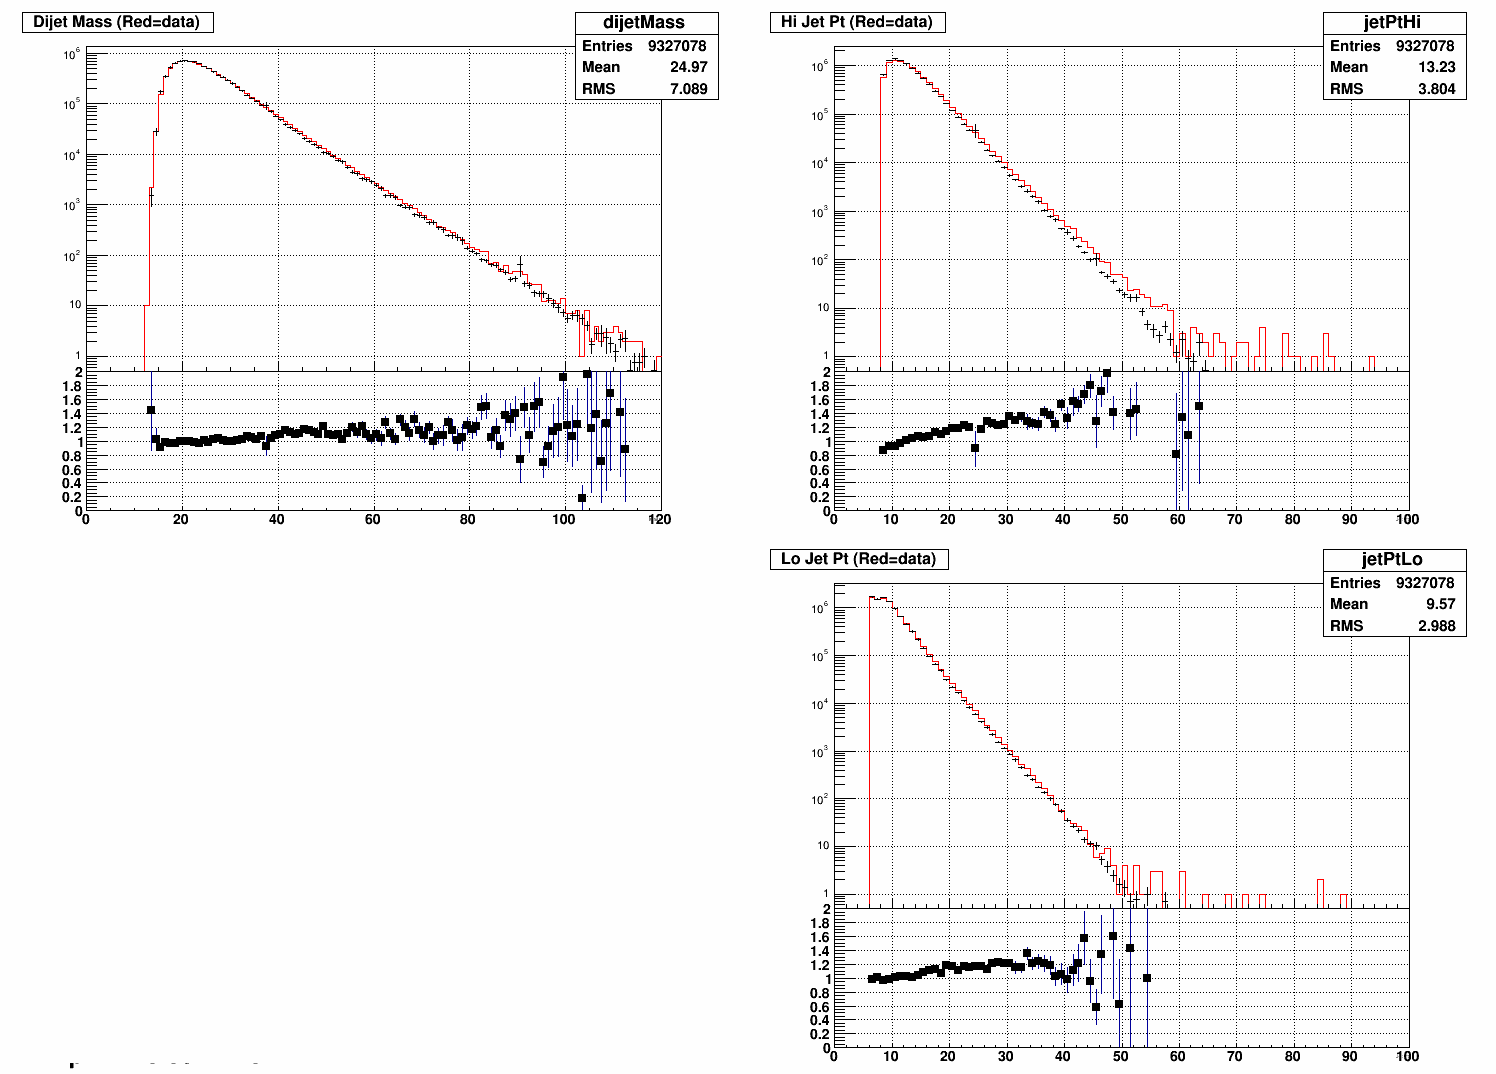
Dijet mass and jet pt.
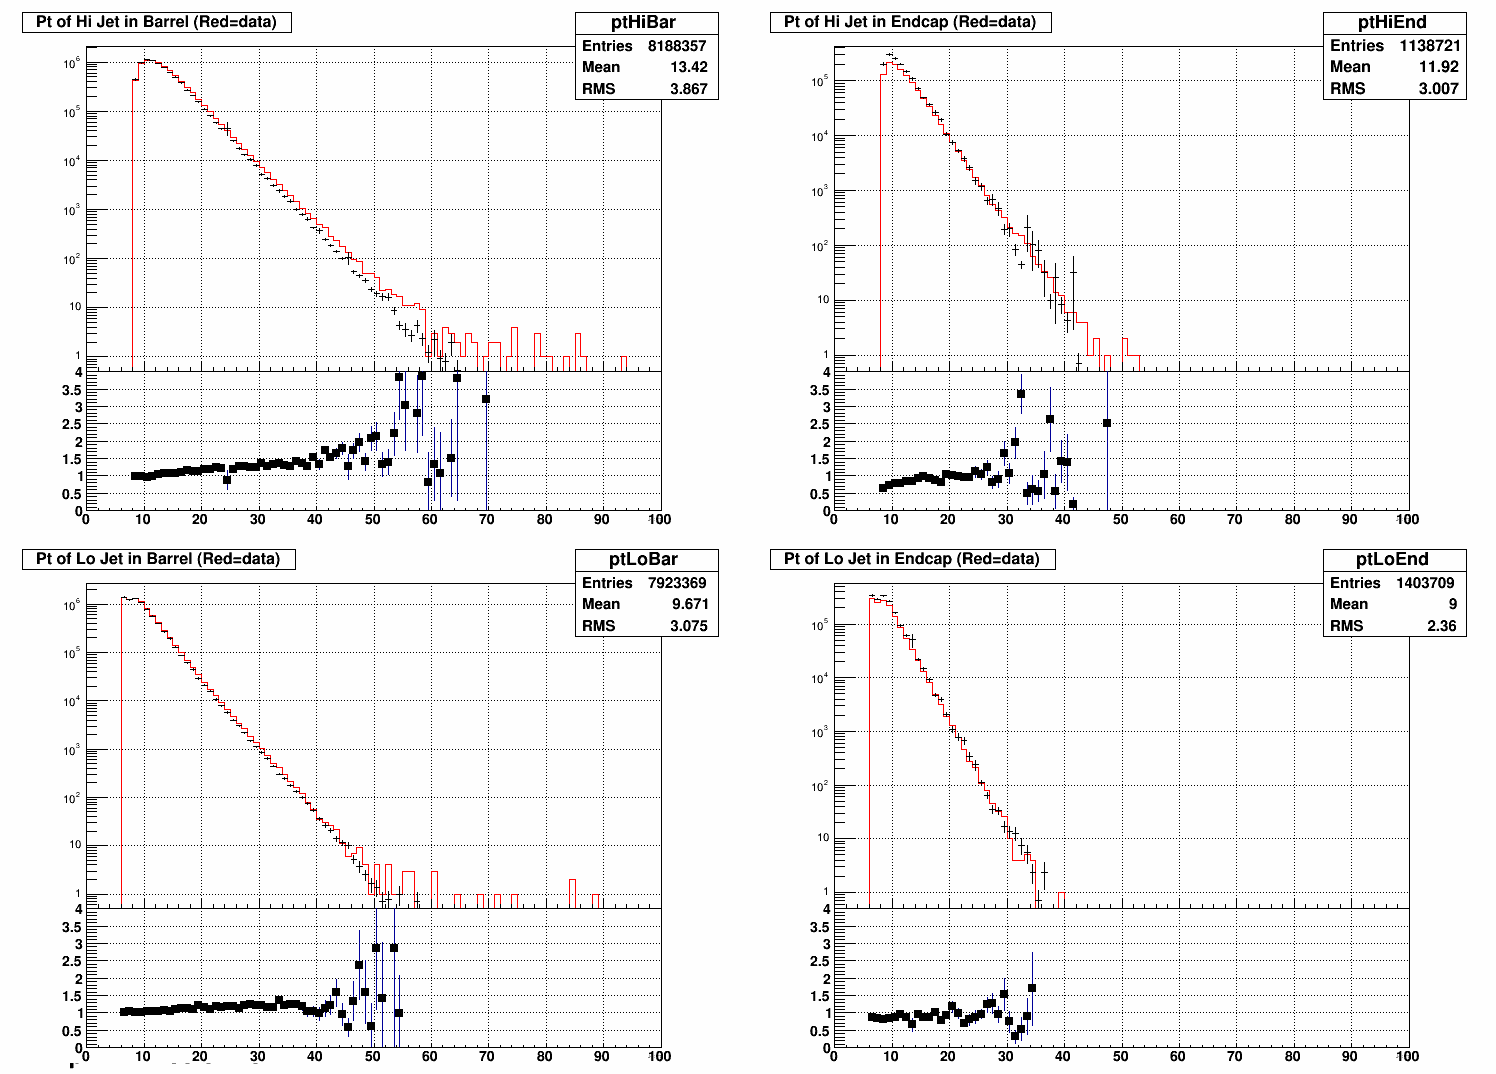
Jet pt in barrel and encap.
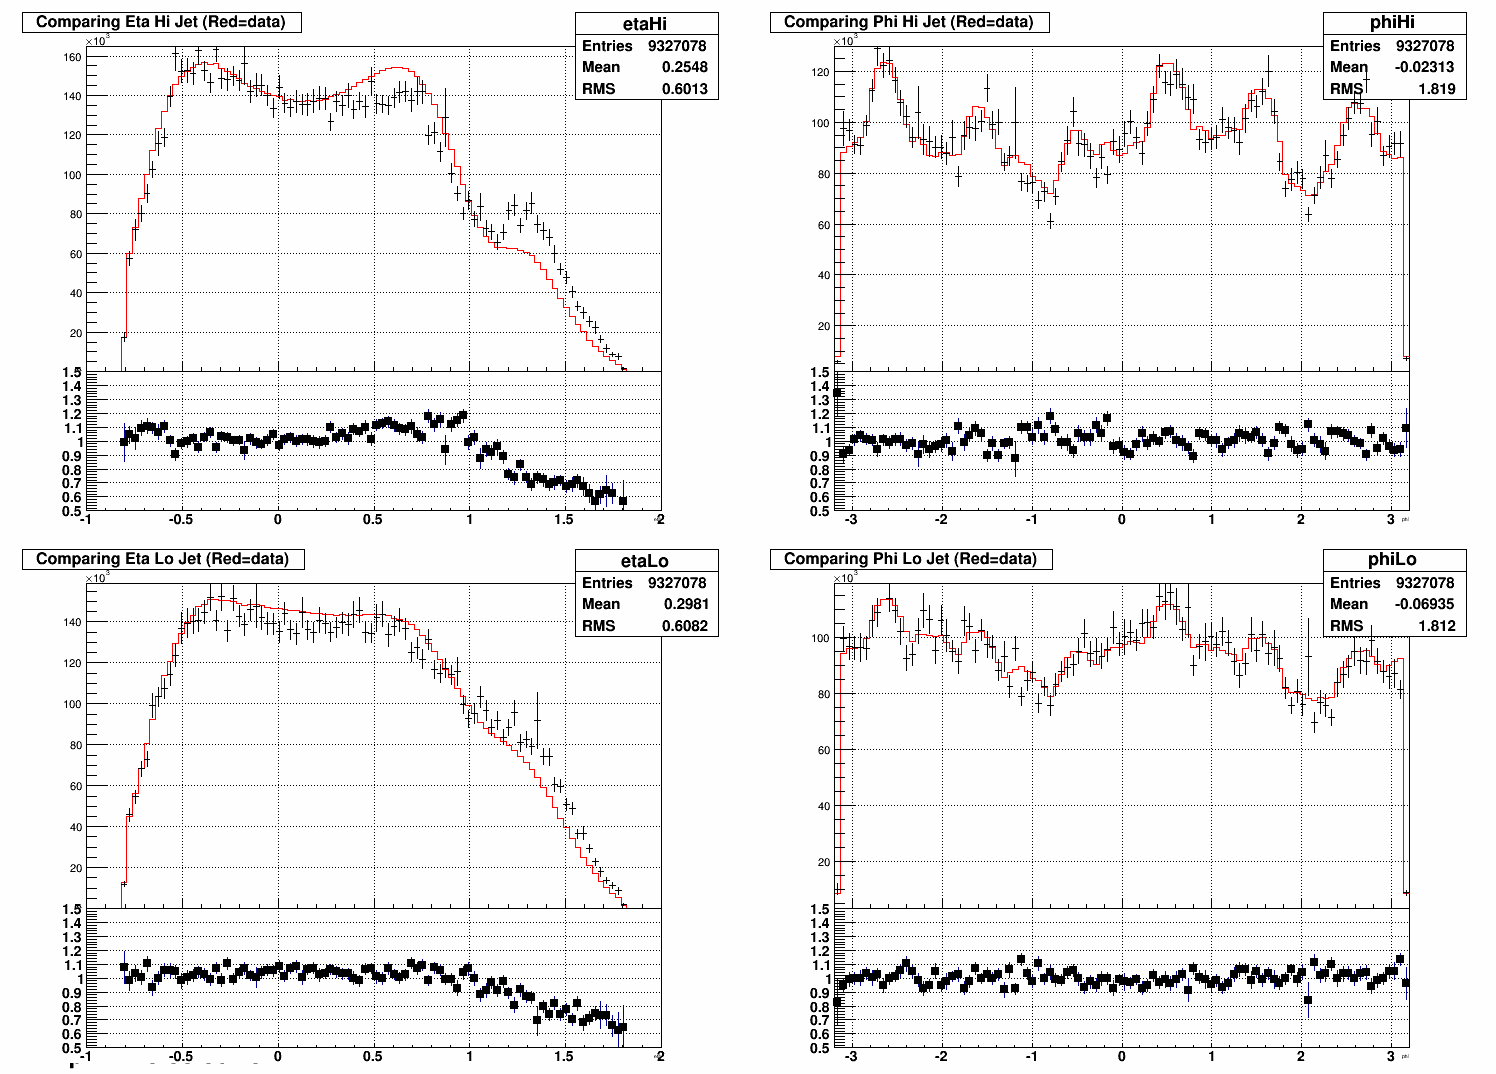
Eta and phi. Generally there is good agreement between data/simu except for larger eta, where the simulation overshoots the data.
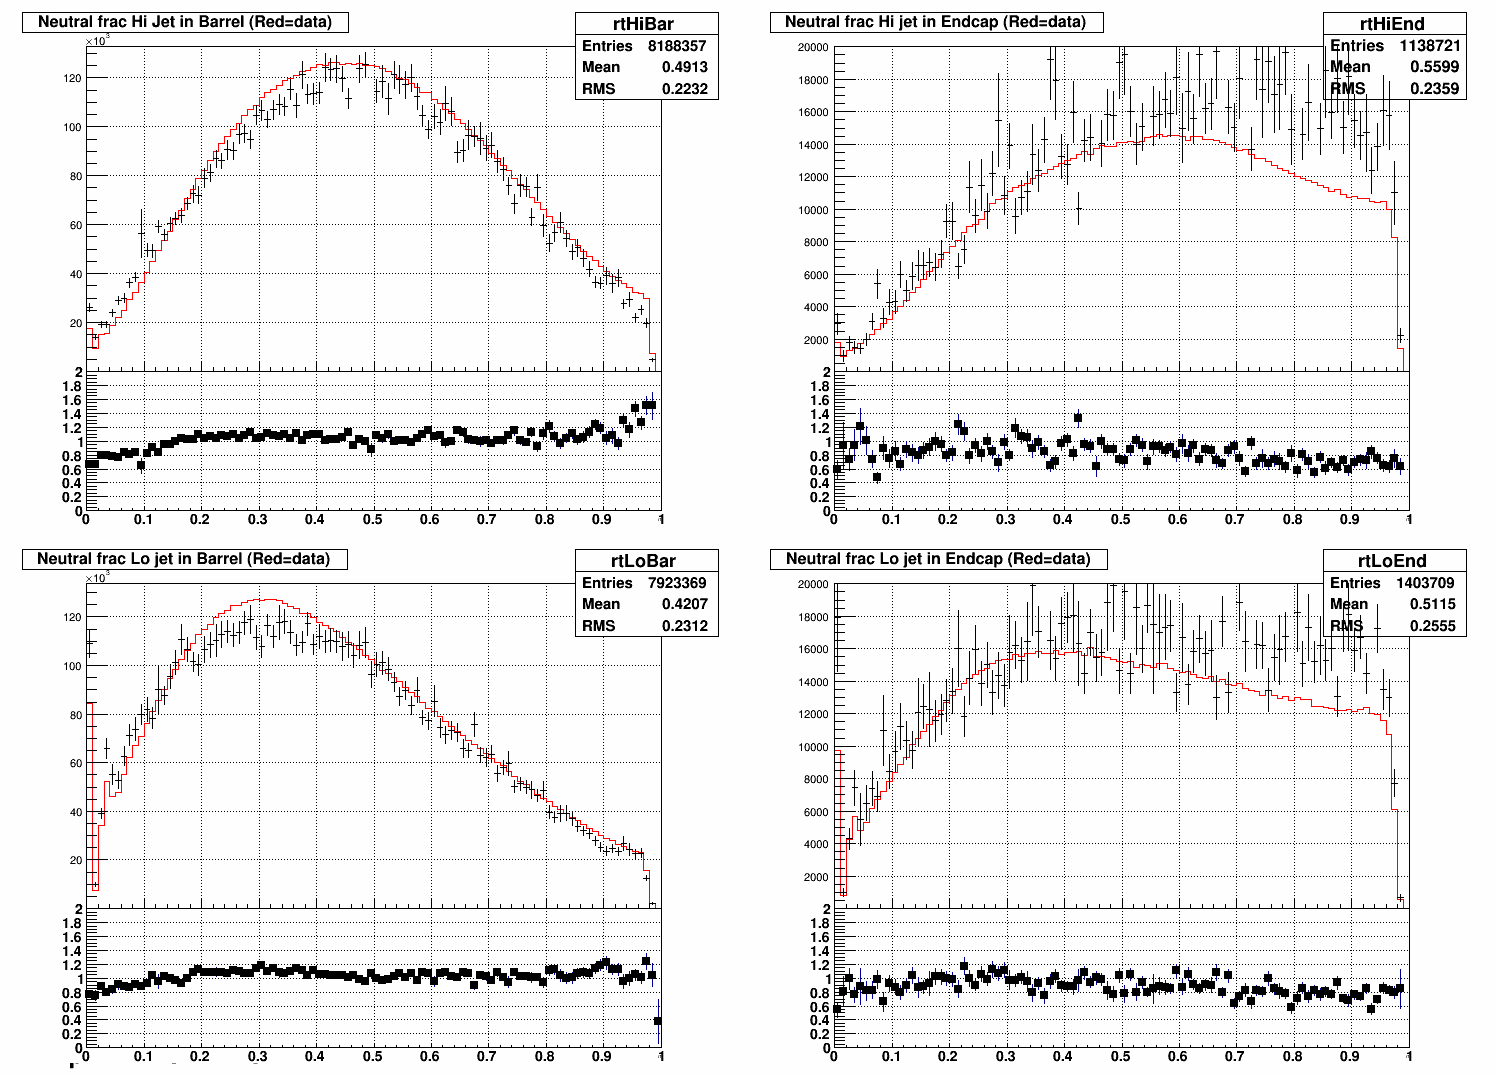
Neutral fraction.
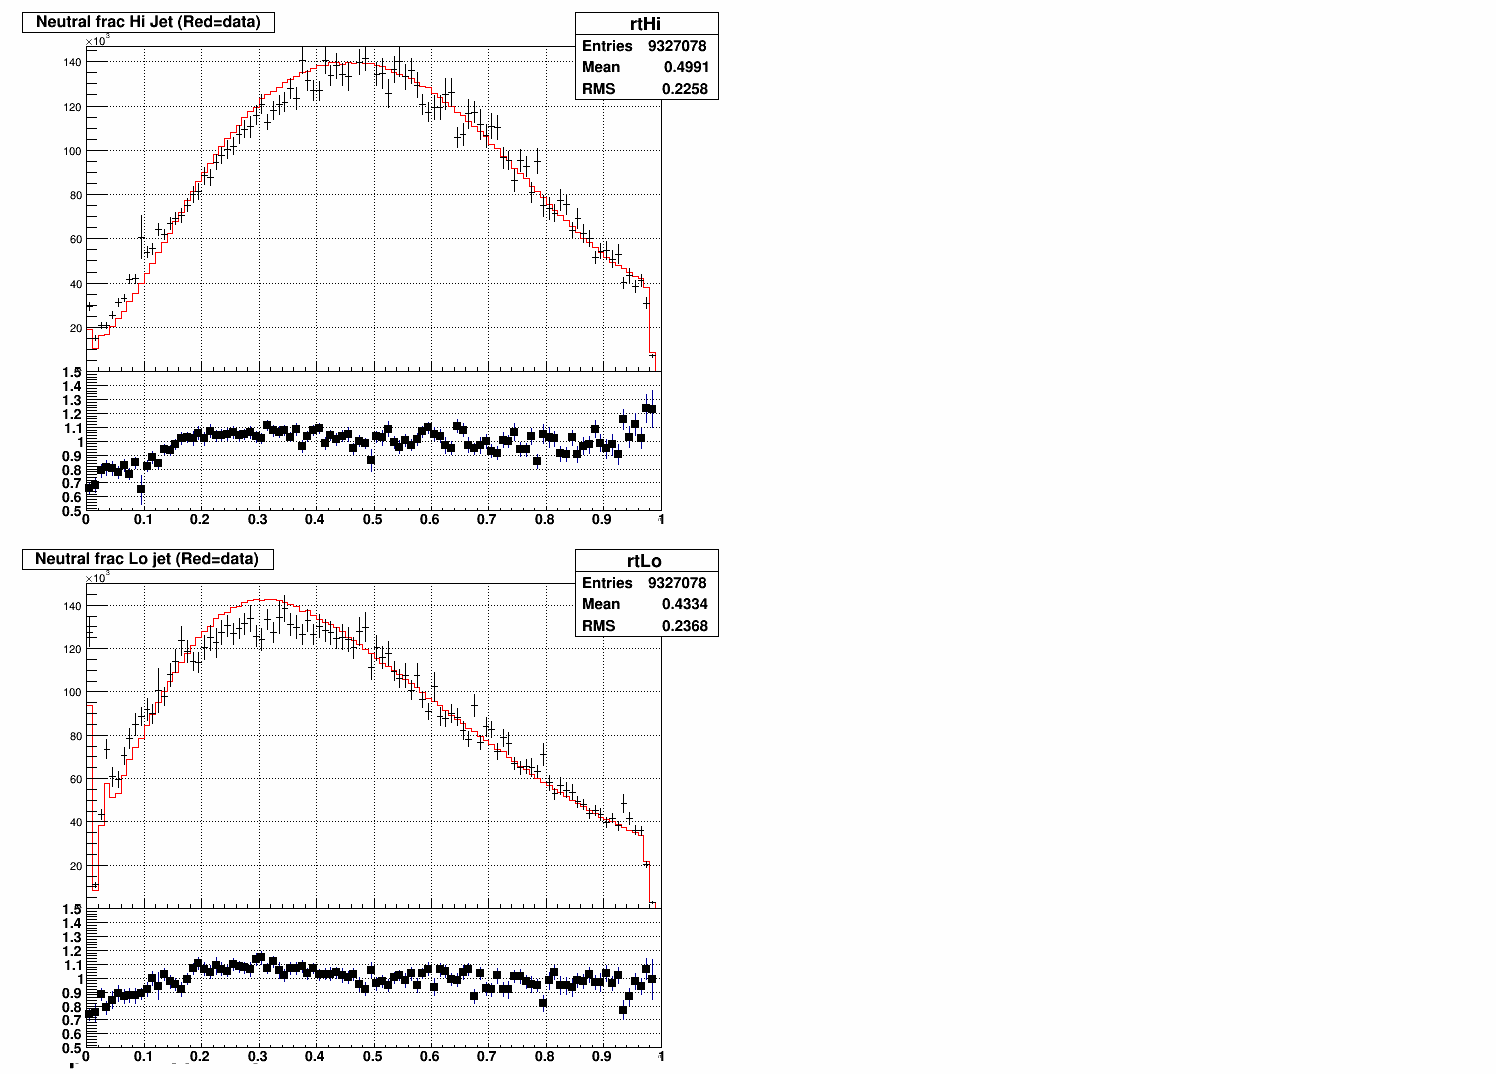
Neutral fraction in barrel and endcap. It appears that the simulation overshoots the real data for endcap jets.
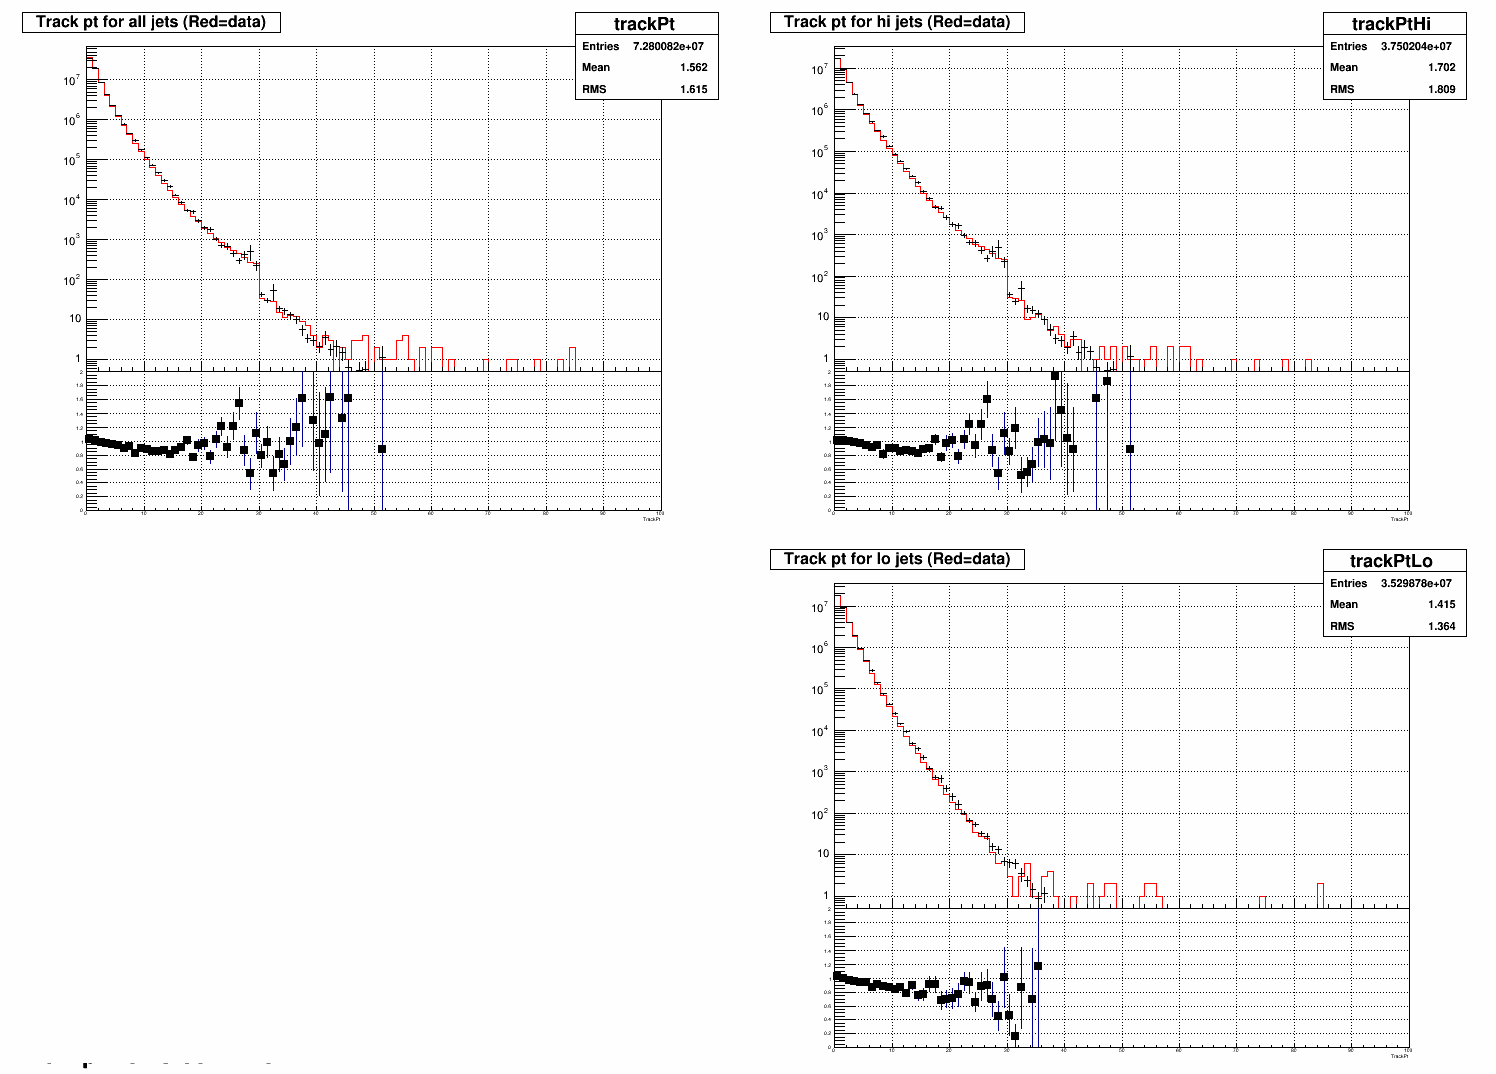
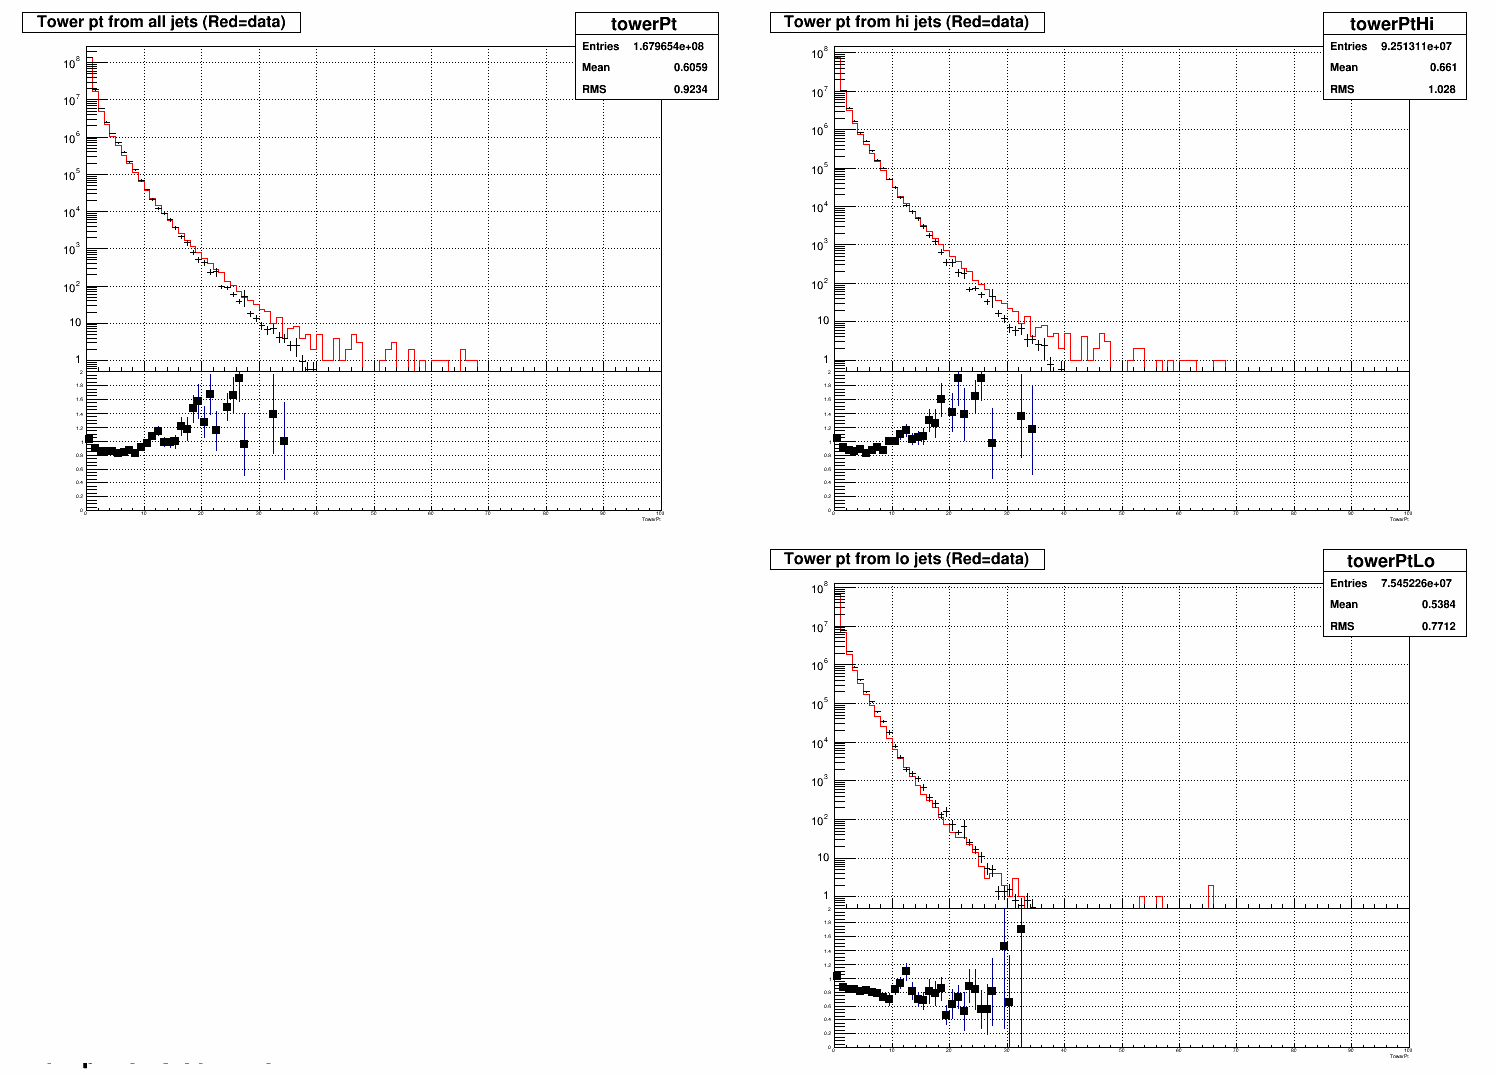
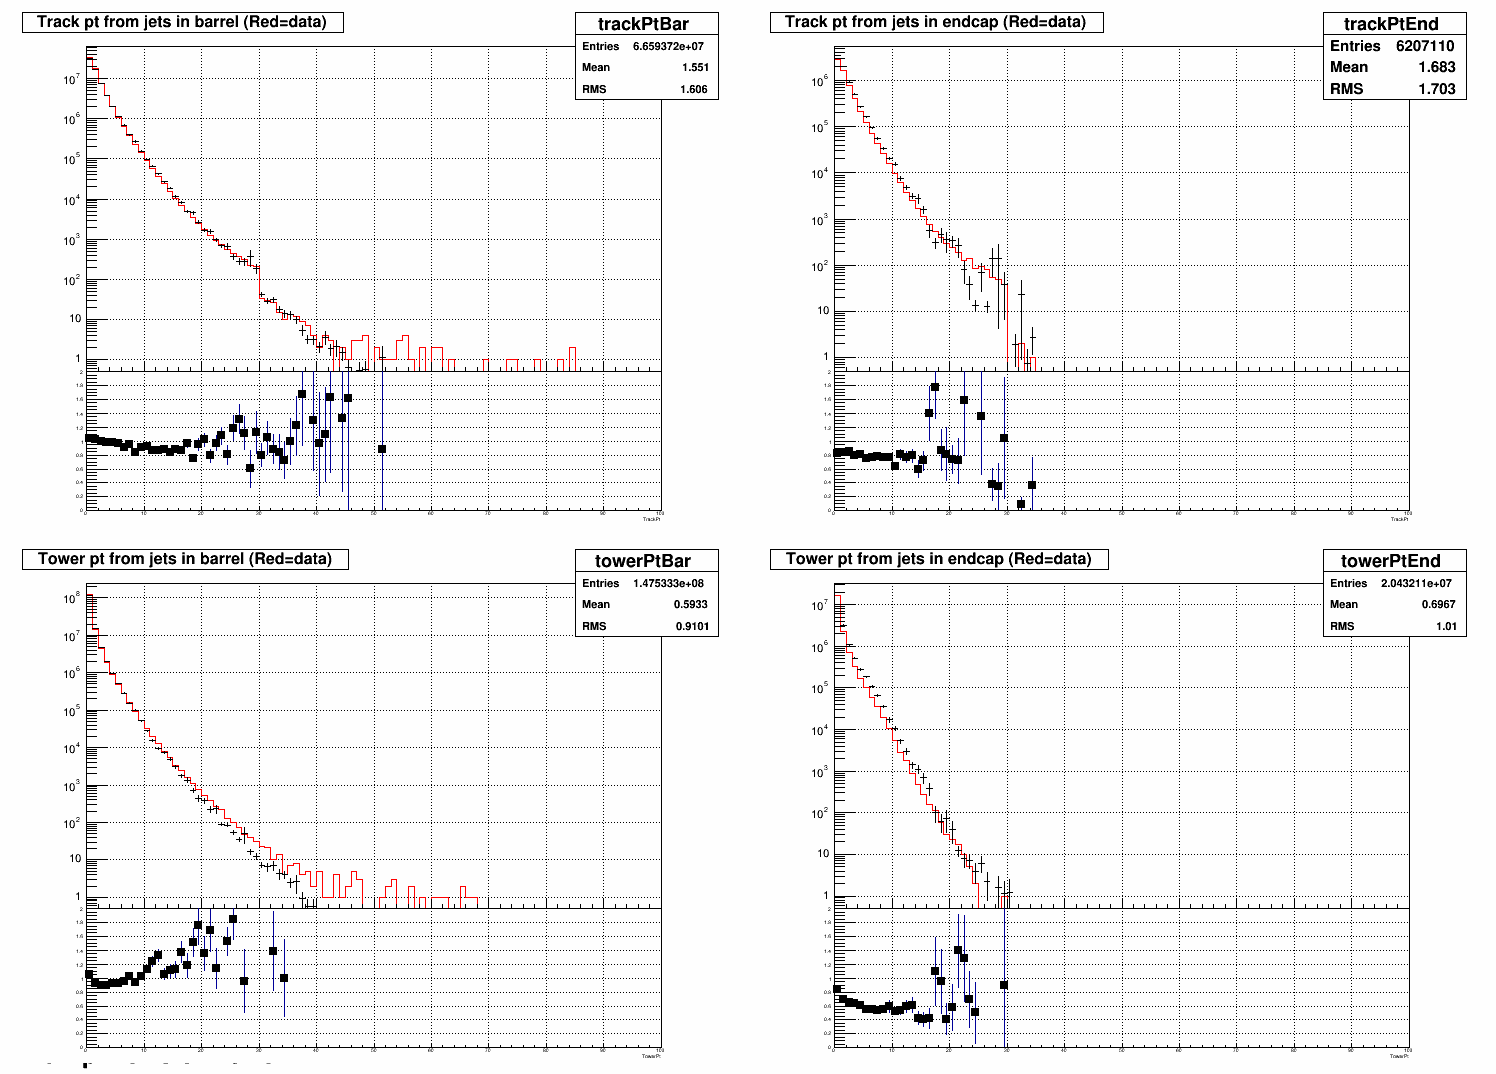
Track and tower pt.
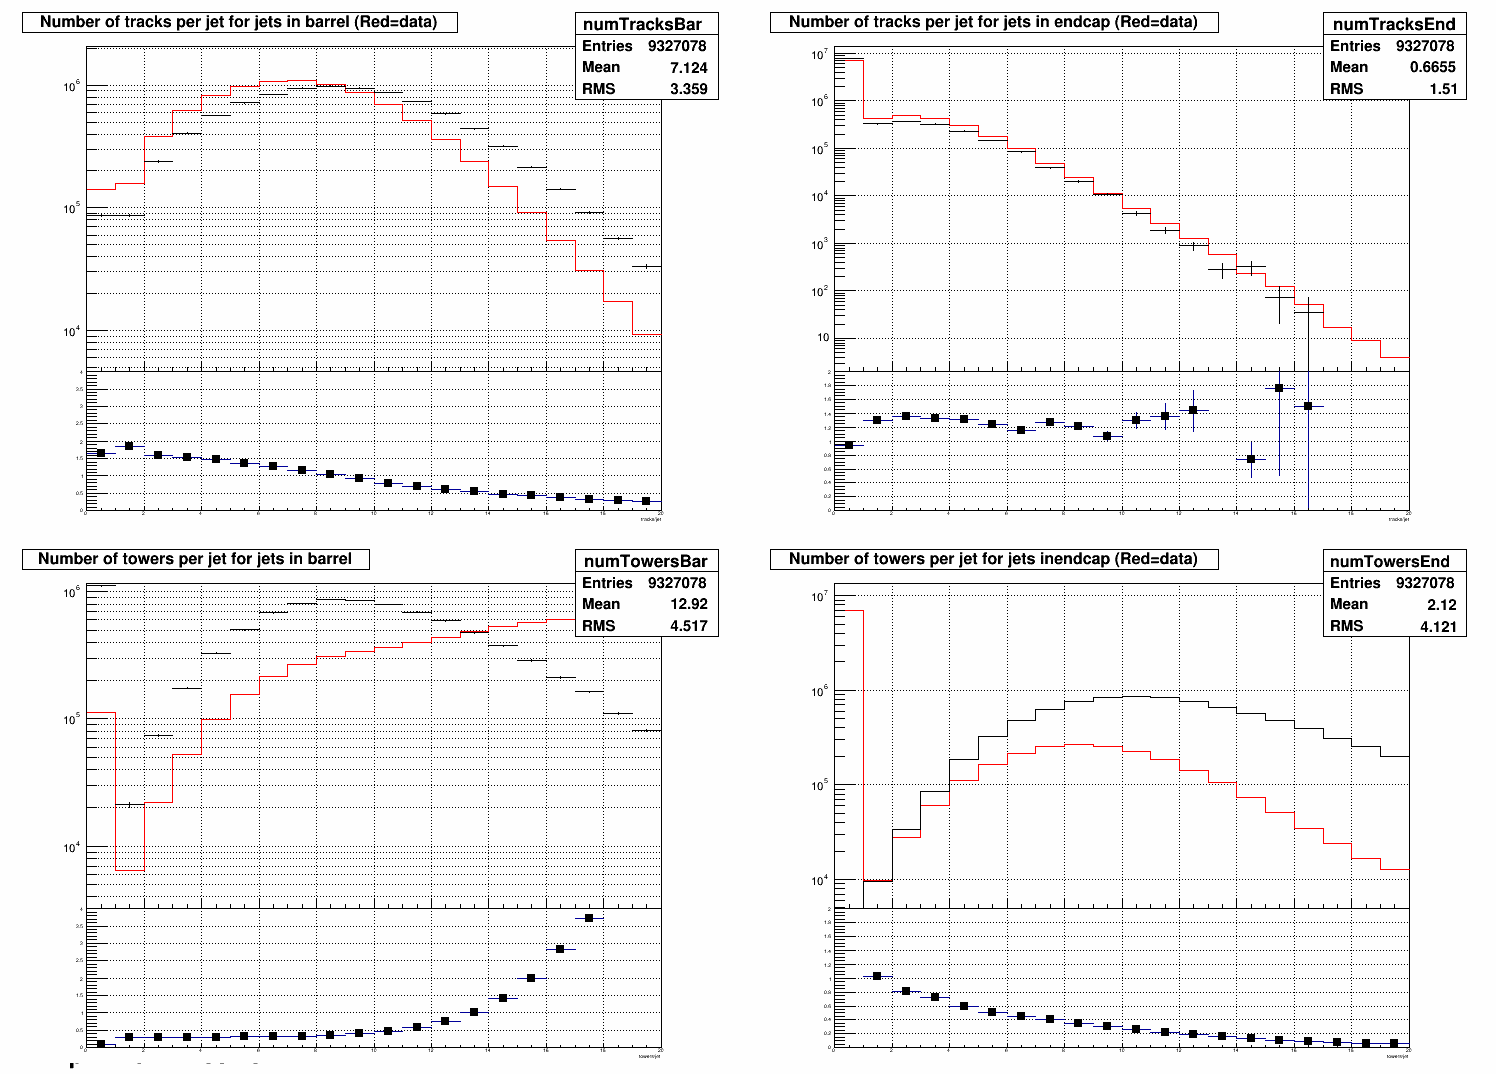
Number of tracks and towers per jet.

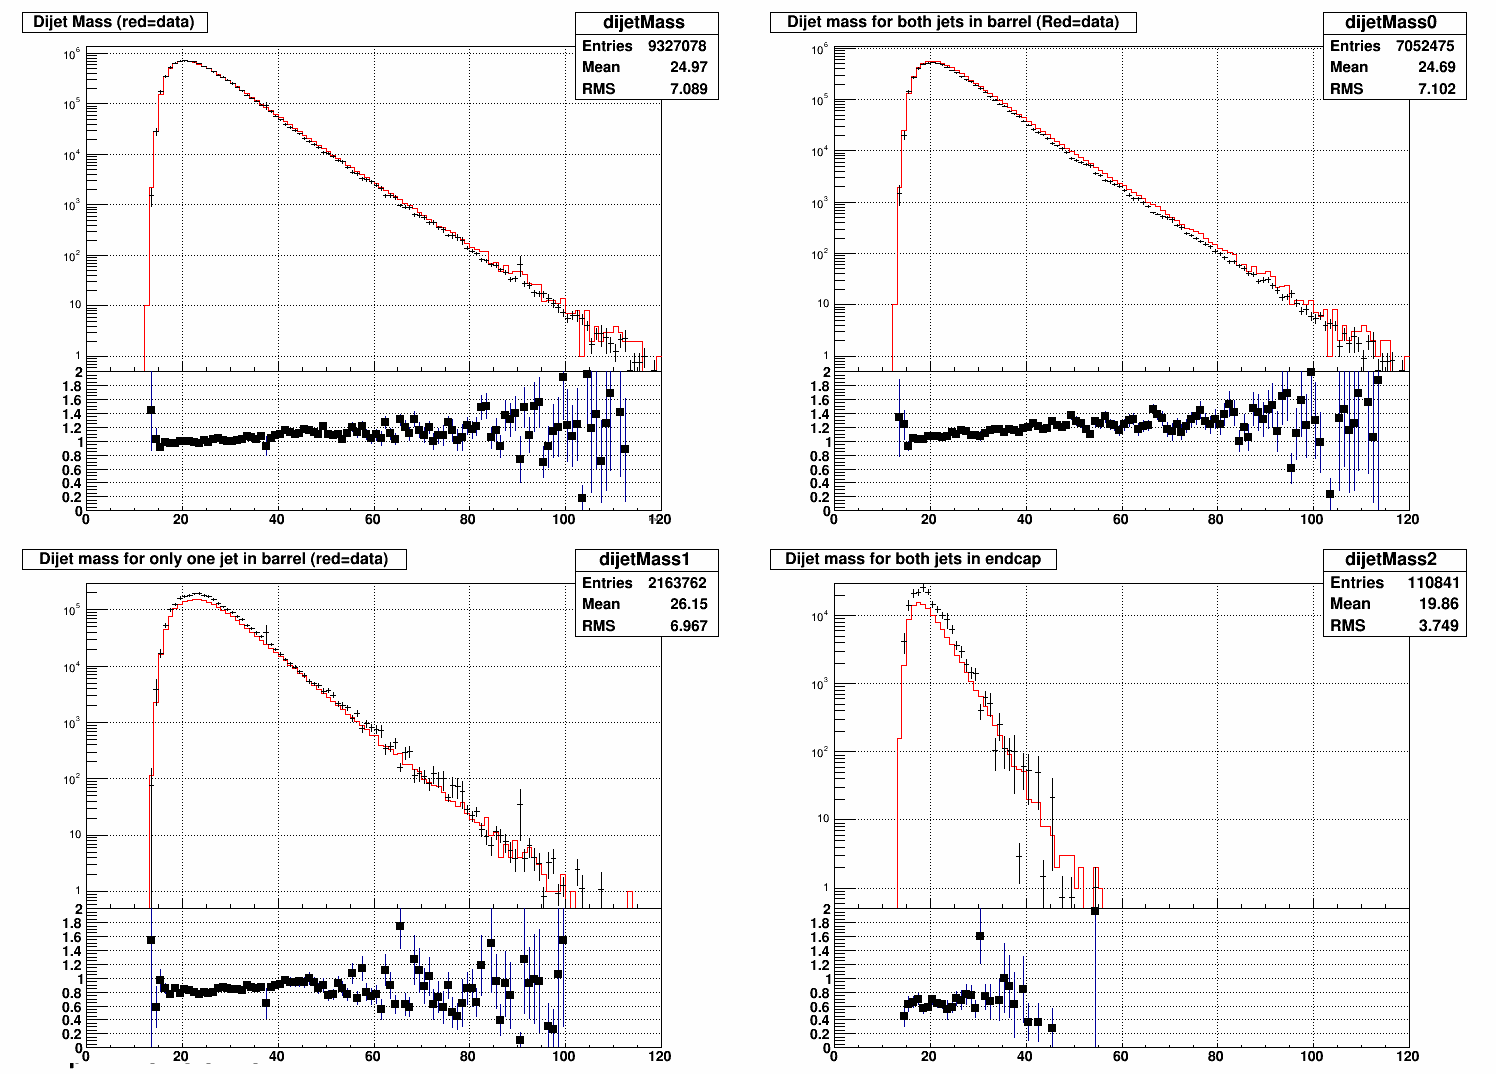
Dijet mass, broken down into dijets that had both jets in the barrel, dijets that had one jet in the barrel and one jet in the endcap, and dijets that had both jets in the endcap. The simulation is noticeably worse for endcap-endcap dijets.
- ezarndt's blog
- Login or register to post comments