Update 07.26.2018 -- Run 9 pp: Systematic Errors, Prior (R = 0.2)
After re-establishing my binning (see the link below), I tried varying the prior used in the unfolding process to get an idea of the corresponding systematic error.
I used two priors: a Levy function, 'L(pT)', and an exponential, 'E(pT)'. These are defined as so:
L(pT) = b * [(2pi * pT) / (1 + ((mT - m) / (n * t)))^n]
E(pT) = b * exp[-pT / t]
Where 'b' is an arbitrary normalization, 'mT = sqrt[pT^2 + m^2]', and 'm' is taken to be the mass of the pion (140 MeV). For each, I then varied 'n' and 't' between these values:
n = {3.8, 4.8, 5.8, 6.8, 7.8}
t = {0.4, 1.4, 2.4, 3.4, 4.4}
The "smeared prior" was then created by convoluting each prior with our response matrix and applying our jet matching efficiency. For each prior, I then unfolded our Run 9 pp (pi0-triggered) charged jet spectrum using the Bayesian algorithm for 'k' between 1 and 5 and selected the result with the best chi2 between the backfolded and measured distributions. These are results:
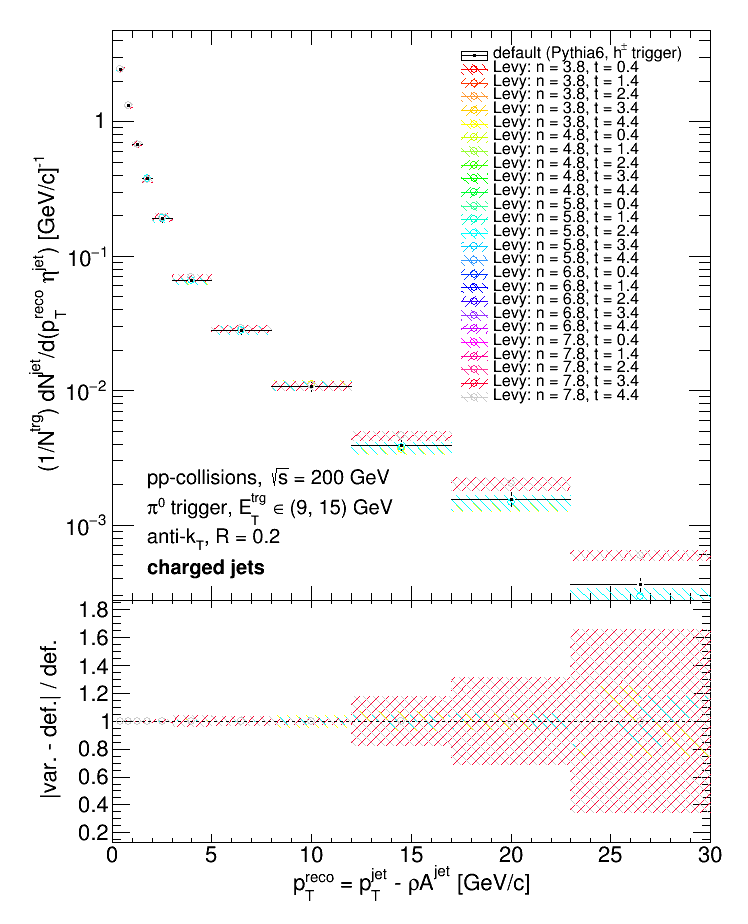
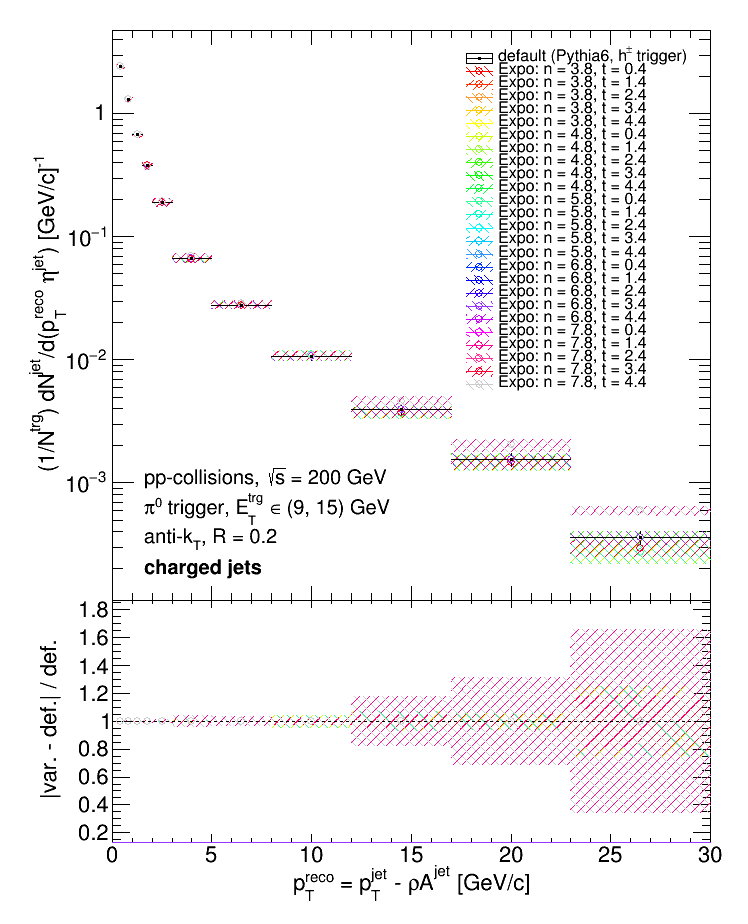
The top panels show the unfolded distributions, and the lower panel shows the %-difference between each unfolded result and the "default" result (the unfolded data using the h+- triggered Pythia6 distributions as priors, the Bayesian algorithm, and 'k = 3'). The %-difference is the difference between the central values of the unfolded distributions and the central value of the default distribution, i.e.
diff = |unfold - default| / default
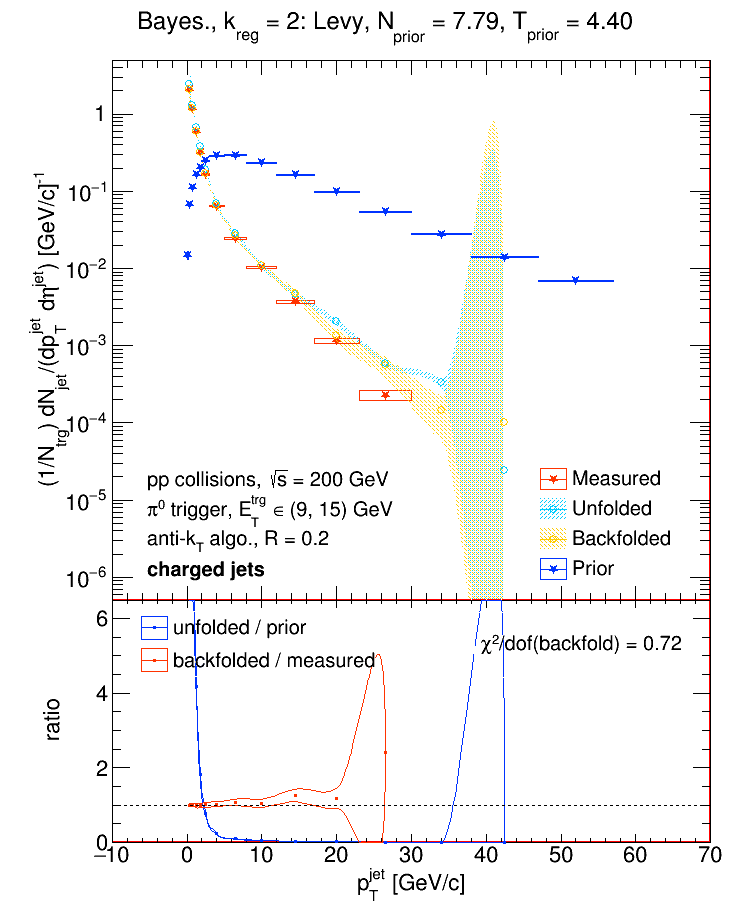
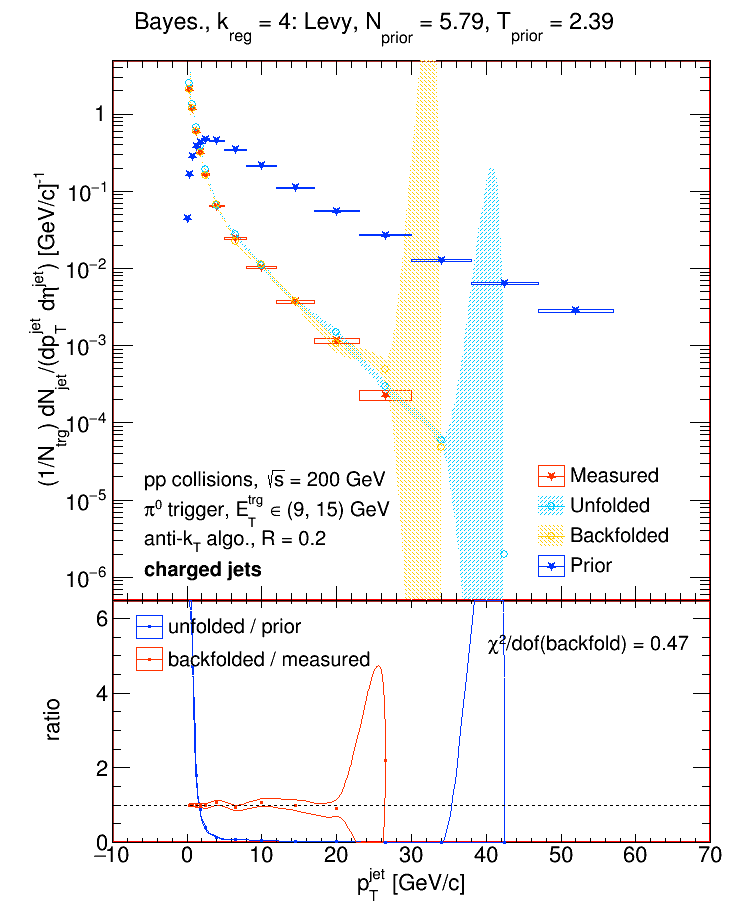
and is represented as error bars about a value of 1. Below are some examples of different priors vs. the measured, unfolded, and backfolded distributions.
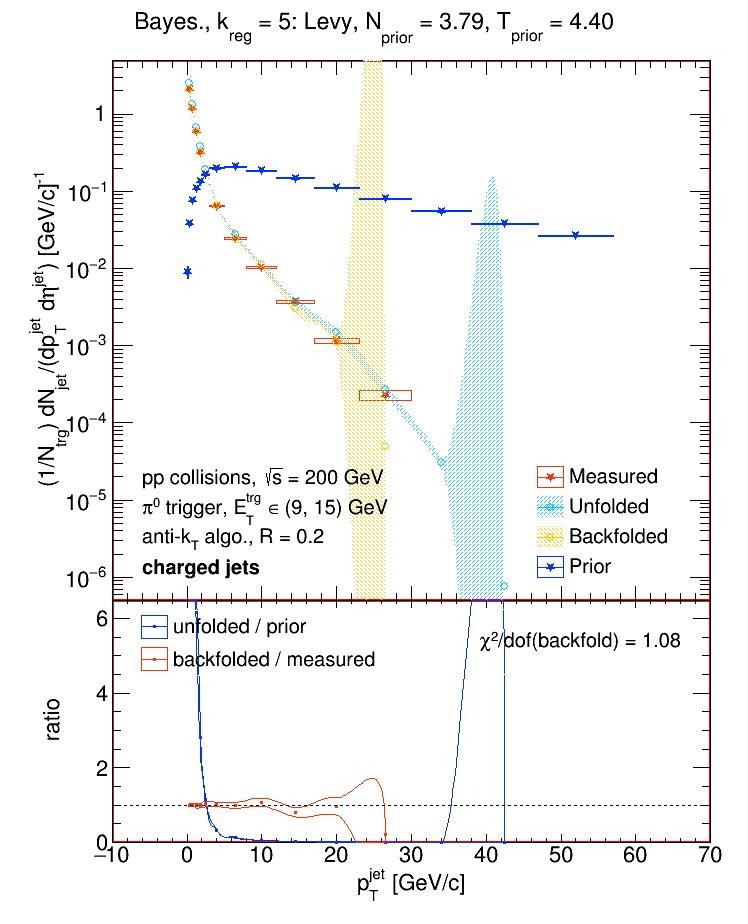
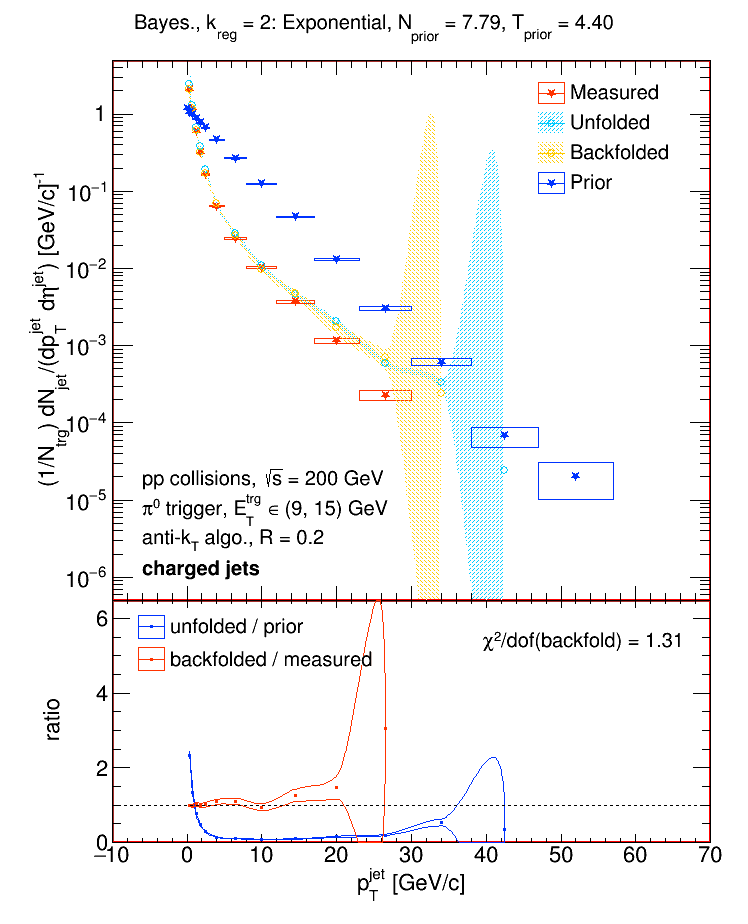
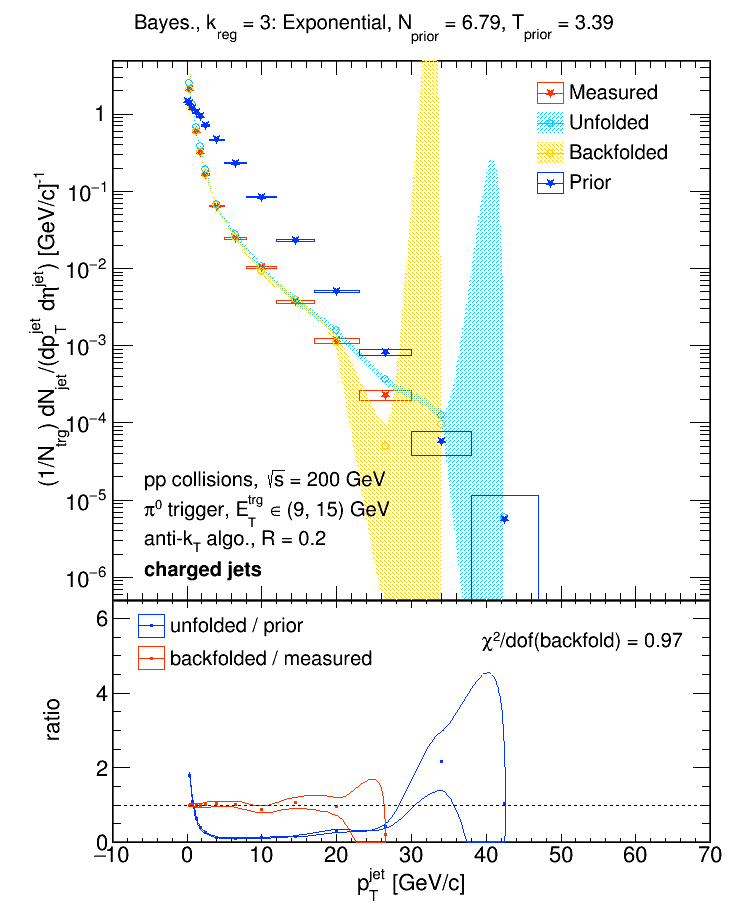

Note: the 'n' and 't' values in the plots above are slightly off. Add 0.01 to get the actual values!
- dmawxc's blog
- Login or register to post comments