- dilks's home page
- Posts
- 2019
- 2018
- December (1)
- November (1)
- October (1)
- August (2)
- July (4)
- June (3)
- May (1)
- April (2)
- March (2)
- February (1)
- January (5)
- 2017
- December (3)
- November (1)
- October (2)
- September (3)
- August (2)
- July (2)
- June (1)
- May (2)
- March (3)
- February (3)
- January (3)
- 2016
- November (2)
- September (4)
- August (2)
- July (6)
- June (2)
- May (3)
- April (1)
- March (2)
- February (3)
- January (2)
- 2015
- December (3)
- October (3)
- September (2)
- August (6)
- June (3)
- May (3)
- April (4)
- March (3)
- February (5)
- January (3)
- 2014
- December (1)
- November (1)
- October (3)
- September (4)
- August (3)
- July (3)
- June (2)
- May (2)
- April (2)
- March (1)
- 2013
- 2012
- 2011
- My blog
- Post new blog entry
- All blogs
Run 12 TCU Inputs from FP201
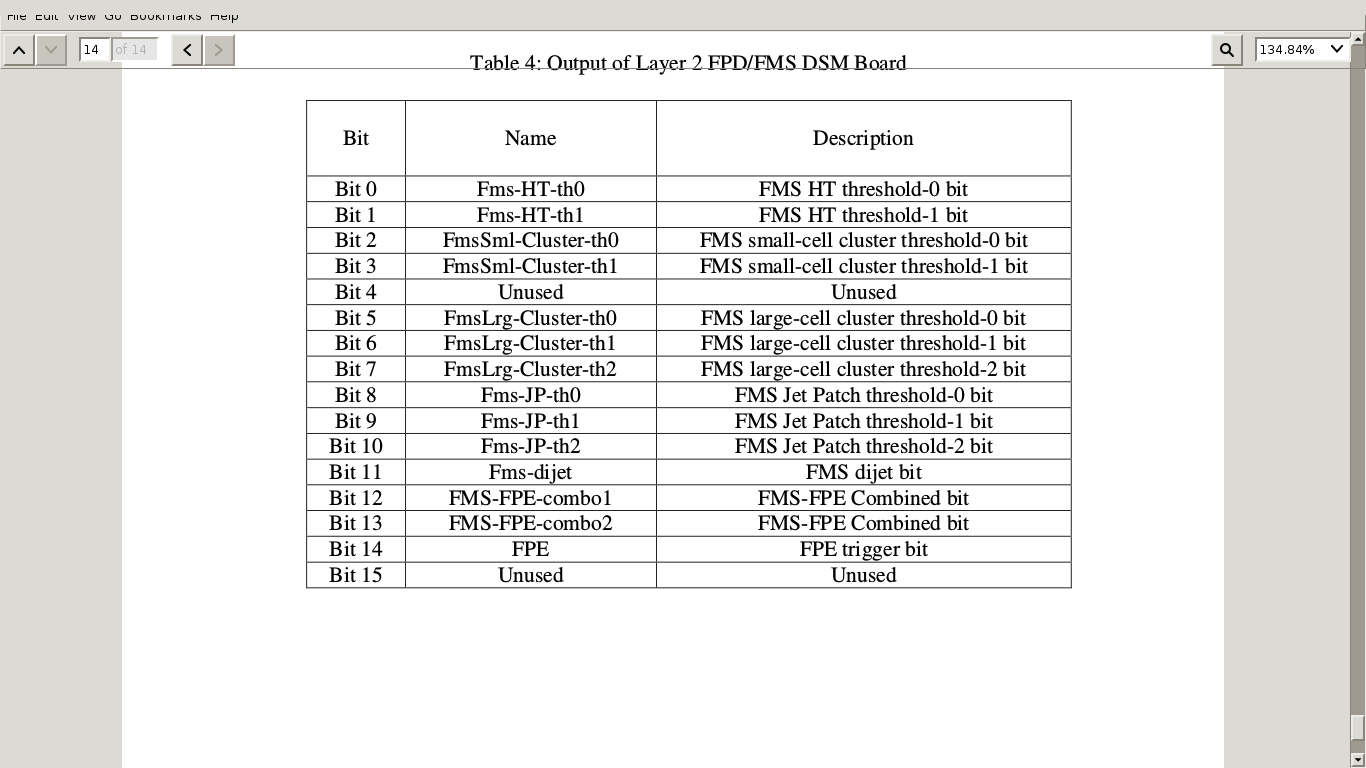
We have found that L2sum[0]==L2sum[1], up to occasional single-bit differences. This is problematic, since many triggers we would like to select are supposed to be in L2sum[1] but aren't accessible. Since the FMS L2 bits (DSM FP201) are sent into channel 5 of the TCU, we can examine the trigger tree variable lastdsm[5] as well. The following study uses this variable along with the 2012 FMS DSM algorithm documentation for the bit map, shown in the following table:
Trigger Thresholds:
JP0 -- 14
JP1 -- 18
JP2 -- 29 (takeall)
SmBS0 -- 13
SmBS1 -- 22 (takeall)
LgBS0 -- 17
LgBS1 -- 25 (takeall)
LgBS2 -- 25 (??)
HT0 -- 4
HT1 -- 8
.
.
Trigger Prescales
![[ PLOTTED VS RUN INDEX HERE -- http://www.star.bnl.gov/protected/spin/dilks/trgmon12/500/prescale_canv.png ]](http://www.star.bnl.gov/protected/spin/dilks/trgmon12/500/prescale_canv.png)
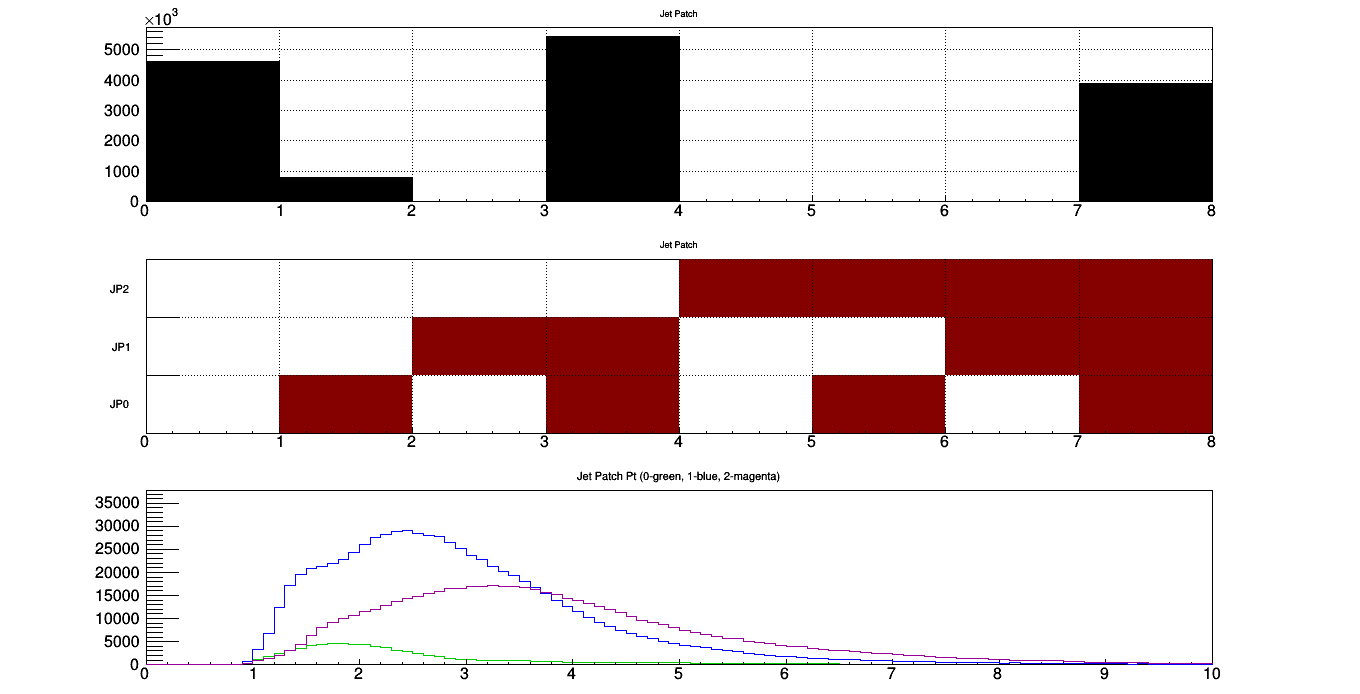
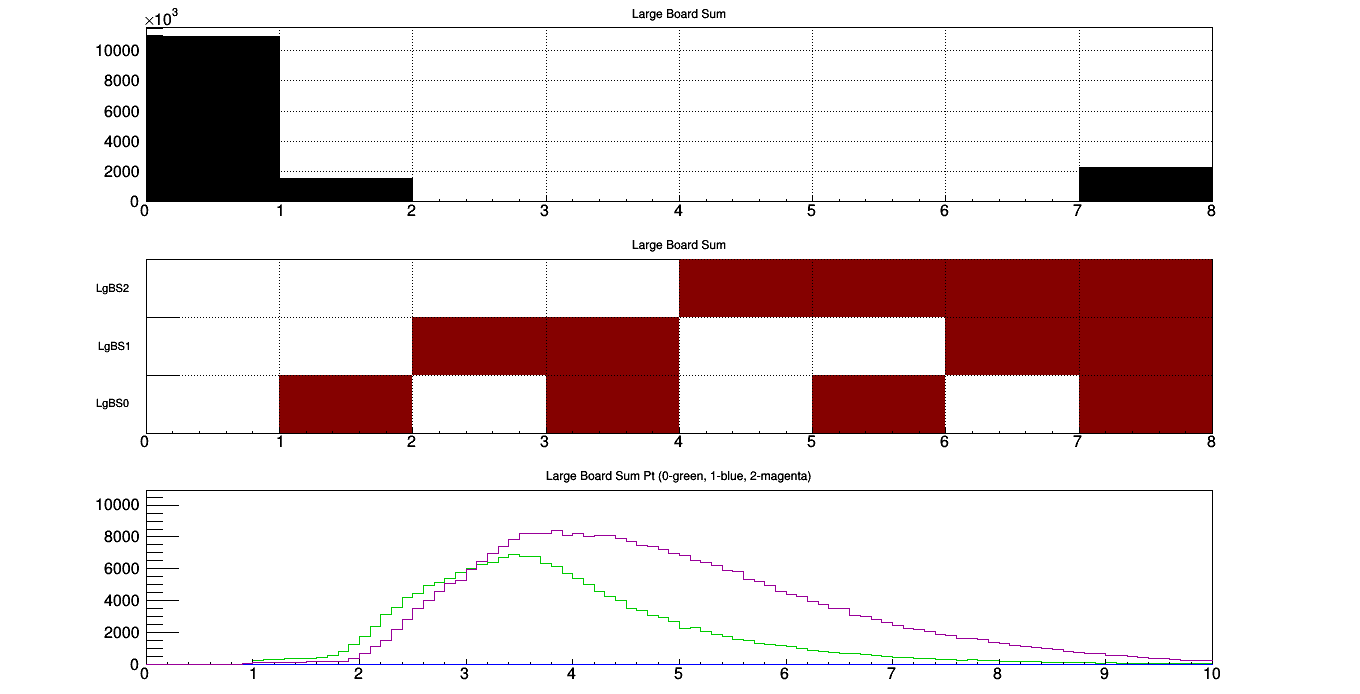
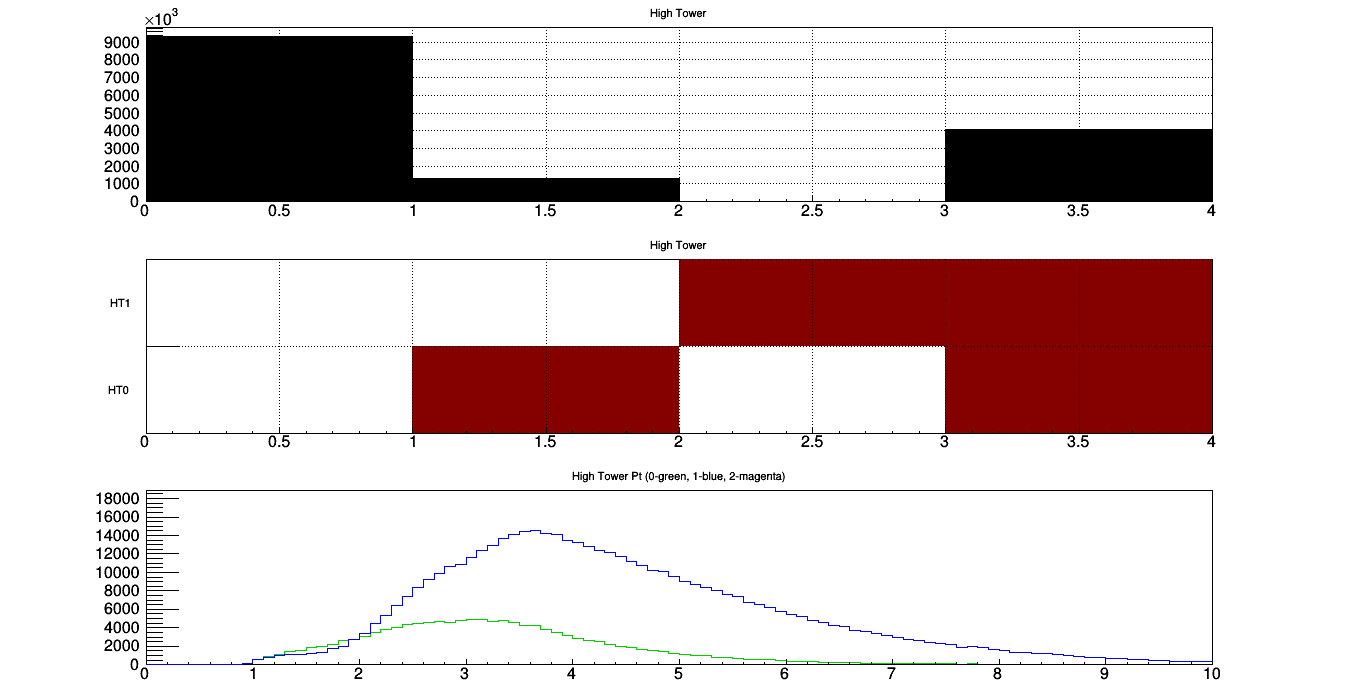
The following images are for each class of triggers {JP, SmBS, LgBS, HT}; each has three panes:
-- Each column in the middle plot represents a single combination of the 2 or 3 triggers within each trigger class, denoted by the red boxes
-- The histogram at the top is the number of events of the corresponding trigger combination directly below it. Notice that a higher threshold trigger will always satisfy the lower threshold trigger(s).
-- The bottom plot shows the pT distributions, where the colors are defined by the trigger number (e.g. "1" in the JP plots means "JP1", specifically, "JP1 & JP0" since lower threshold triggers will also fire)
Runs from two well-seperated days are plotted, 80 and 108, which show how much the trigger pT thresholds increase, likely because of radiation damage
Few runs from DAY 80:
.
.

.
.
.
.
.
.
.
.
Few runs from DAY 108:
.png)
.
.
.png)
.
.
.png)
.
.
.png)
Groups:
- dilks's blog
- Login or register to post comments