Correlation between ToT and HV currents
Hi All,
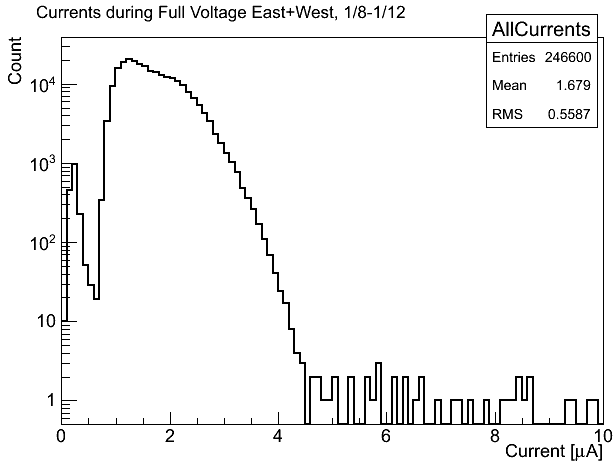
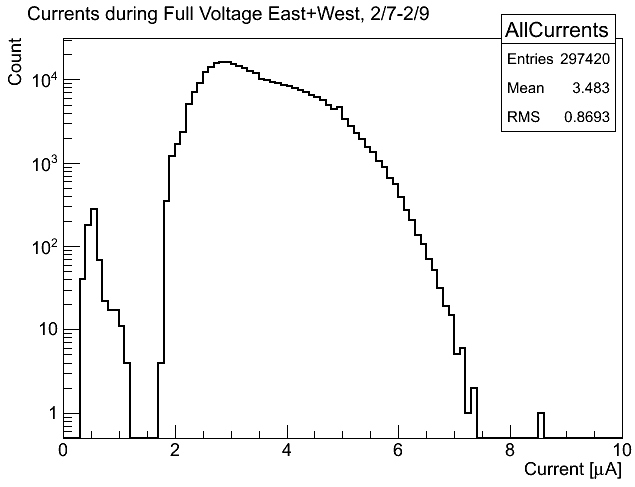
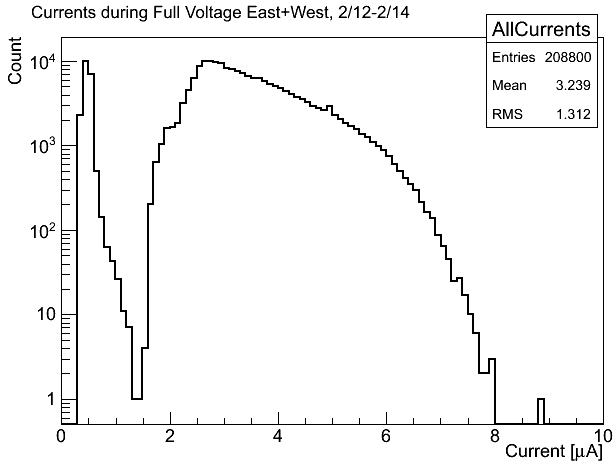
Bill Llope asked if I saw any change in the HV current over time. Specifically he asked about 01/08/10-01/12/10 (days 8 to 12 :), 02/07/10-02/09/10 (days 38 to 40), 02/12/10-2/15/10 (days 43 to 45) and then 02/28/10-03/04/10 (days 59 to 63).
I decided to histogram the current values when the HV was 6990 < HV < 7010. Keep in mind that this will include the last portion of the current peak during the ramp up to full voltage.
Here is 01/08/10-01/12/10 (days 8 to 12)
then 02/07/10-02/09/10 (days 38 to 40)
then 02/12/10-2/15/10 (days 43 to 45)
and finally 02/28/10-03/04/10 (days 59 to 63)
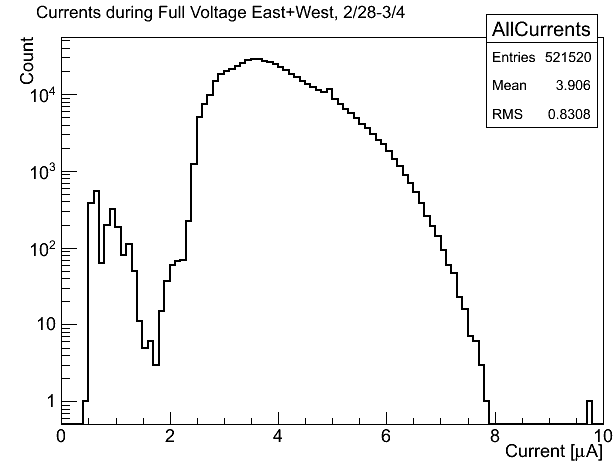
As one can see there is a marked increase in the high current count for later runs.
When showing these plots to Bill he had the following to say:
I suspect there could/should be a correlation between the HV currents and the shapes of the tot dists..... i.e. if there is, as the data implies, a significant evolution in the MRPC performance vs day number that results in generally larger signals (more streamers etc) then one might expect that the HV currents would also reflect that evolution...
To be quantitative here we'd of course need to scale to the typical rich scaler rates for these periods (to divide out any possible changes in the luminosities in the spills in these different periods), but this is a very interesting start.
- bbiritz's blog
- Login or register to post comments